


Get Email Updates
Get an email the instant your dream home hits the market with your MyLogin account


11/24/2022
Jeff Lichtenstein
Nov 24, 2022
Check out all Current South Florida Market Statistics Here! Find Days on Market, Closed Sales, Active Inventory, Median Sales Price, Mortgage Rates, and more for Palm Beach, Martin, St. Lucie, Broward, Indian River, and Miami-Dade!
We had our first Turkey-less Thanksgiving. I went full pescatarian 5 years ago after having my kidney removed. I have nothing against a good steak but felt I’d be less tempted to have French Fries if not ordering it. It’s hard to not have fries when ordering a burger. Then the ketchup and onion rings. Salmon is more asparagus friendly for the side dish. Although I did have a meatball when I visited Sweden a few years ago (my moral dilemma) and accidental bacon is permitted. It’s very hard to avoid bacon as it’s on everything from Cobb Salads to every appetizer you can imagine so that is my natural loophole.
One benefit of being a pescatarian is I didn’t consume as much for Thanksgiving other than a lot of lettuce. Less volume of food = less stuffed. And that mirrors exactly what is going on right now in the housing market. LESS TRANSACTIONS!
Below is a link to 21 graphs as we examine 5 categories in both Palm Beach County and Martin County. We also did separate graphs for both single family homes and condos/townhomes + one bonus graph.
Before absorbing the graphs it’s important to understand context. This was an excellent article that ran in the Palm Beach Post going over the short term and long-term aspects of the housing market. The second one “Is Now A Good Time To Buy” I wrote and posted 2 weeks ago about the market as well. My headlines stay the same, there will be short term opportunities to buy if you are in the market. Prices are dropping naturally because sellers are not raising prices and re-indexing according to inflation. Must sellers outweigh must buyers. Over the long haul, our area is an outlier because we don’t have enough homes to meet the population net gain (estimated at 18,000 a year in Palm Beach County).
A few other thoughts. Pending inventory dropped -41.8% in single family homes from 2022 to 2021 for SFH in PBC. 2700 homes in 2022 to 1,572 homes. New listings are actually about the same and down 6.9% since last year. The Fed by raising rates is cooling the market so it’s not so ridiculously so 1 sided. That has worked. As total inventory grows and other parts of the economy are infected with job losses, rates will go down. As housing stabilization occurs ( I think 3rd quarter 2023 for South Florida), our market has some risk of accelerating re-sale home prices because of the amount of growth here (people need shelter), lack of land, lack of new home builds and values now not keeping up with real inflation. I wouldn’t be surprised to see prices jump suddenly in double digits by this time next year.
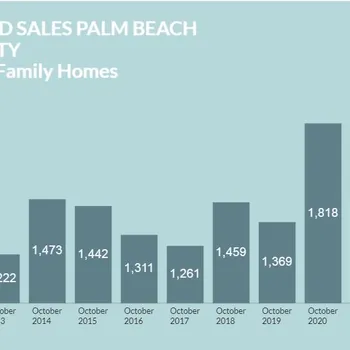
Number 1#. Closed sales were down 28.7% for single family homes in Palm Beach County in October 2022 versus October 2021. This has been the 7th straight month of 20-30% decreases in the volume of transactions……
We did a secondary graph going back a decade to show how low the volume is and that is despite much more population. Some of this is because so many transactions took place since 2020 but also because interest rates going up has had the intended effect of the Fed. Interestingly enough, cash sales versus closed sales are about equal which is the same as 2021.
Made withVisme
Made withVisme
Made withVisme
Made withVisme
Median Prices are up 14% from a year ago for SFH in PBC. Prices are still steady. However as stated earlier, they are down 9% nationwide and with inflation, really much farther down. Other than the real inflation home value loss, there still are too many people moving here for us to see a big push downwards. Sellers are not in desperate situations as they are good on paper and unemployment is still relatively low.
Made withVisme
Made withVisme
Made withVisme
Made withVisme
Active Inventory is really the tale of the tape. It’s up 93.8% for SFH in PBC. WOW. That is until you compare it to 2018 and 2019 levels. It has a long long way to go which is why you aren’t seeing prices drop. *However, new construction starts and specs really lessons the supply greatly. It’s going to take a long time for builders to rev up and start building for a while. As new homes are getting completed, the lack of building is going to put downward pressure on inventory.. Furthermore, resale inventory buildup is occurring during the deadest seasonal months where seasonal renters and snowbirds are not around. It should continue to rise but it’s still super low when you look at the 5 year graph.
Made withVisme
Made withVisme
Made withVisme
Made withVisme
Months of Inventory is up even more as a percentage compared to active inventory at a 146.2% differential on single family homes in PBC. We are now at 3.2 months’ supply for single family versus a ridiculous 1.3 months. We won’t see new homes sales build until this number hits 5%+ because they complete with resales. Builders are right now are at 9.1% inventory supply according to Housing Wire. They have cut back which is why you are seeing lumber down and job loss coming. Releases will be King for a while.
Made withVisme
Made withVisme
Made withVisme
Made withVisme
Original list price is down -3.4% for SFH in PBC compared to a year ago when it was practically full price or bust (98.7%). Today it’s at 95.3%. That is historically pretty good. The old rule of thumb was if you come in 10% off on an average looking home priced properly, you should get a response back and settle somewhere in between. Homes that are remodeled with the better views always needed to come in tighter. That’s exactly where we are today.
Made withVisme
Made withVisme
Made withVisme
Made withVisme
A few other thoughts. Pending inventory dropped -41.8% in single family homes from 2022 to 2021. 2700 homes in 2022 to 1,572 homes. New listings are actually about the same and down 6.9% since last year. The Fed by raising rates is cooling the market so it’s not so ridiculously so 1 sided. That has worked. As total inventory grows and other parts of the economy are infected with job losses, rates will go down. As housing stabilization occurs ( I think 3rd quarter 2023 for South Florida), our market has some risk of accelerating re-sale home prices because of the amount of growth here (people need shelter), lack of land, lack of new home builds and values now not keeping up with real inflation.
Made withVisme
Made withVisme
Jeff Lichtenstein is owner and broker of Echo Fine Properties, a luxury real estate brokerage selling real estate in Jupiter and homes in Palm Beach Gardens, Florida. He has 20 years of real estate experience, has closed over 1,000 transactions, and manages over 70 agents in a non-traditional model of real estate that mimics a traditional business model. Some publications he has been quoted in.
Feel free to ask him a question directly at [email protected] including a complimentary real valuation of your home.
Jeff Lichtenstein, originally from Chicago, got his start in the home furnishings textile business where he traveled over 35 weeks a year selling fabrics. After the family business was sold, Jeff moved to Florida and became a real estate agent. Today he is the owner and broker of Echo Fine Properties, a luxury residential brokerage voted best brokerage of the year. Jeff manages a non-traditional model of real estate that mimics a traditional business model. Echo has 100 agents, an average of one million dollars per transaction and over 500 million in annual sales. Between traveling for work and annual family trips to national parks with his wife and 2 now adult children, Jeff has visited 49 states. He is also one of the few Chicago White Sox fans you’ll ever meet. Some publications he has been quoted in.
Author of business & leadership book How Making a Sandwich Can Change Your World – The Amazing Success of the PB&J Strategy – Available to Buy Now!
Feel free to ask him a question directly at [email protected] including a complementary valuation of your home.


or Create your MyHomes account today?

In only 30 seconds you will have full access to property, community info and SOLD data you can't get anywhere else.