Get Email Updates
Get an email the instant your dream home hits the market with your MyLogin account


23 MAY
Jeff Lichtenstein | Broker/Owner Echo Fine Properties
COVID has wiped out so many industries:
Unemployment is at 14.7% and jobless claims are still rising.
The world as we knew it in February 2020 looks nothing like the world in May of 2020.
But (somehow) we are still selling homes–– and we are moving them at a rate not too dissimilar to the rate at which we sold houses in 2019.
Wait, what?!? How in the world are we selling so many homes when the world is spiraling into a COVID-based abyss ?!?
Here is a theory as to why….
The Last Crash
The last time we had a crisis in the market (2008), unemployment peaked at just under 10%.
At the same time, home sales fell by 30% (worse in Florida –– and pricing fell by about the same percentage.
Why was real estate impacted so dramatically last time? Besides the fact we were manufacturing unqualified buyers via the use of subprime loans, we were also overproducing homes to keep up with the falsely inflated demand.
In other words, (in 2008) BOTH sides of the supply/demand curve were massively screwed up
In other words, BOTH sides of the supply/demand curve were massively screwed up.
When the music stopped in 2008, the lending market seized and the mortgage loans the market needed to absorb the inventory of housing vanished nearly overnight.
When homebuyers can’t get loans, they stop buying houses.
And thus, we ended up trying to wade our way through the massive oversupply of expensive homes with no loans and even fewer jobs. It was basically a 5-year slog to right the market.
** A quick note about unemployment in 2020 –– the majority of the job losses have come from the service sector and less from the white-collar sector. The service sector tends to have more tenants than owners and thus COVID-based unemployment has disproportionately impacted rental markets more than ‘for sale’ markets (at least as of the date this post was written.) **
Home building Still Hasn’t Recovered
No one felt this more than our home builders.
The chart above of new home starts (the measurement of how many single-family homes are being built) vividly illustrates this –– in 2006, builders were building close to 2M new homes per year to satiate demand.
By 2009, home starts had fallen by 80% (and no, that is not a typo.)
Again –– EIGHTY PERCENT LOWER.
Let that sink in for a moment.
Why does what happened 12 years ago matter? Because housing starts never recovered and since the bottom of the market, we have been shorting the country’s need for new housing substantially –– by some estimates the deficit now totals between 3,000,000 and 4,000,000 homes.
The Rapid Inversion
Fast forward to March of 2020 –– inventory levels have fallen from nearly 3 year’s worth of inventory immediately following the crash to as little as 4.3 months in 2020. When COVID arrived, unemployment was at historic lows and millennial homebuyers were entering the market in force.
In other words, the market had flipped –– and in a big way.
The number of homes required to keep pace with demand is wholly inadequate and thus, in less than a decade, the market pivoted from a total buyer’s market to a total seller’s market.
As a matter of fact, entering 2020, it was more of a seller’s market than it had ever been.
(Un)Balanced Markets
Economic law basically states that when demand exceeds supply, prices rise –– and the opposite holds true as well.
In April of 2012, inventory hit 8 months and pricing stopped falling.
This is not a newsflash.
As it relates to housing –– it is generally accepted that a balanced market (demand = supply) has anywhere from 6 to 8 months of inventory.
Just to summarize:
Since inventory fell below the 6-month threshold and has managed to stay there, pricing in our market has continued to increase.
The Depth of the Imbalance
When prices rise, it means the number of buyers exceeds the number of sellers.
So knowing what we know about inventory levels, what happens to buyers when inventory levels fall from 6 months to 4? Or from 4 months to 3? Or from 3 months to 2?
You got it –– more bidding wars.
Or, stated differently –– one winner and a lot of losers who will keep trying until they finally win one.
A.k.a. –– unsatisfied (or excess) demand.
And it is this excess demand that both kept the market from selling more homes in the years immediately preceding COVID and what has kept the market going during COVID.
Measuring Demand
Let’s look at how deep it is.
While MLS does not tell us how many offers come in on any single home, the conditions of the sale allow us to draw certain conclusions.
By examining the price at which the home closed (sold) relative to the asking price of the home, you can see how much above (or below) a seller received for the home.
As any agent can attest to, bidding wars are common in anywhere from 20-40% of the homes that are sold (depending on price and location) and everyone who does not win, remains in the buying pool.
Think of it this way, when a home receives 10 offers, 9 buyers go home unsatisfied and begin the process again –– and thus the number of homes sold in any given time period is ALWAYS either at or below the number of homes that could have sold.
So COVID could, in theory, wipe out 10% of the demand for housing and the market would barely notice.
So if we are going to look at how deep the excess demand is, we need to make some assumptions about how many offers are received based on the results in MLS.
For our model, we will make the following assumptions:
We will also assume that for any home that sold above asking price, a buyer made 3 offers to in order to get one accepted.
Here are the results:
As you can tell, markets are undersupplied by anywhere from provided you assume it takes a buyer 3 contracts to win a deal. If you believe that the number of offers to secure a home is closer to 2, then the undersupply number jumps substantially.
Furthermore, our little spot in the Palm Beaches might be in the best spot in the country which is opposite of what occurred in 2008.
That, my friends, is what is saving us right now.
Implication
In 2019, MLS tracked 27,966 sales
Yet, the number of multiple-offers tells us that if enough inventory had been available, the number could have been larger –– especially in the affordable and urban markets.
So COVID could, in theory, wipe out 10% of the demand for housing and the market would barely notice. And this is not even taking into effect that sellers are not listing their homes at the same rate as last year and building starts are down 30% according to the latest news –– which further restricts supply.
In other words –– as long as the number of buyers exceeds the number of sellers, we should still see price increases and multi-offer situations –– albeit maybe not at the same rate as prior years.
News, Sorta …
My sense is we are about to see some negative news coming out about the housing market –– and it will be flawed and ripe for misinterpretation.
The uniformed talking heads will squawk about how sales are down and how builders are struggling –– but they are missing the point. Any decrease in sales is a direct result of the most extreme SUPPLY-side conditions ever, not a fall-off in demand.
Demand is not the problem in 2020 –– it is supply –– and supply is far easier to fix than demand is. Just ask those who made it through 2008.
That is critical to remember.
Summary
That said, the addition of more variables didn’t substantially change the results (provided you agree with the assumptions.)
The last thing we needed was to stop building houses –– yet that is precisely what has happened.
We estimated the number of buyers in any sub-market is at least greater than the number of sellers, and with inventory falling and building slowed, it is going to get worse before it gets better.
The last thing we needed was to stop building houses –– yet that is precisely what has happened. And just so you realize, the spring of 2021 is going to be an absolute zoo, so just be prepared.
At the end of the day, some prospective purchasers have been taken out of the market due to job loss, job uncertainty, or just plain old caution. And if the recovery drags on and furloughed employees become officially laid off, then the problem will get worse.
But when you have (conservatively) 10% more buyers than sellers and the number of sellers is going down, the market will feel just as competitive as ever.
Jeff Lichtenstein
561-346-8383
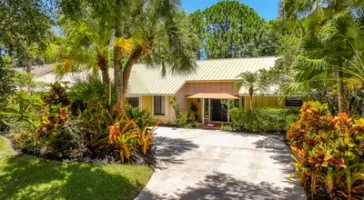
3 Beds | 2 Baths
Contact Charles at ..
Offered at $900,000
More Info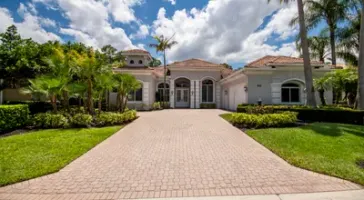
4 Beds | 4/1 Baths
Contact Brian at ..
Offered at $898,990
More Info
3 Beds | 2 Baths
Contact Melissa at ..
Offered at $700,000
More Info
3 Beds | 2/1 Baths
Contact Susan at ..
Offered at $650,000
More Info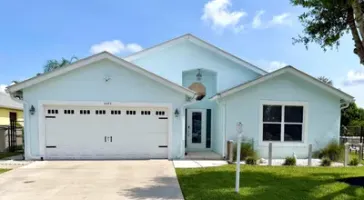


or Create your MyHomes account today?

In only 30 seconds you will have full access to property, community info and SOLD data you can't get anywhere else.