Get Email Updates
Get an email the instant your dream home hits the market with your MyLogin account
Updated October 16, 2026 11:14AM EST



16 SEP
Palm Beach County’s single-family home market remained tight in August 2026, with significantly fewer homes available than a year ago and the supply of inventory continuing to fall.
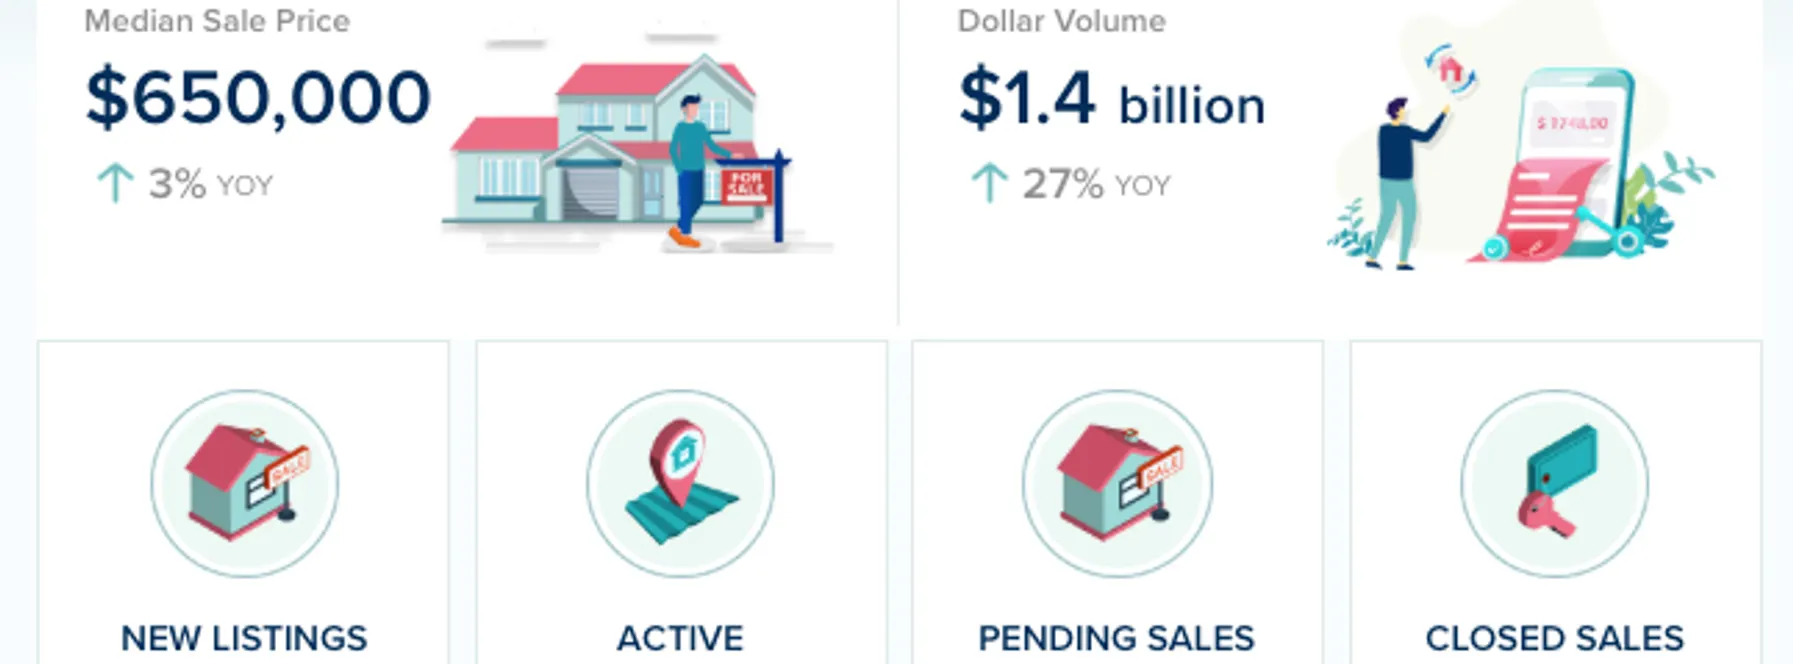
The median sale price increased 3% year-over-year, while active inventory dropped 24% and months of supply fell by a substantial 33%. Homes also sold faster than they did last August.
However, closed sales slipped 2%, creating an important distinction in this month’s numbers: Palm Beach County is experiencing tighter supply and faster selling times, but not an increase in completed transactions.
Here’s a closer look at the August numbers.
📈 Up 3% year-over-year
The median sale price for a single-family home in Palm Beach County reached $650,000 in August, 3% higher than a year ago.
This modest increase comes alongside a significant reduction in available inventory. As always, the countywide median reflects the mix of homes sold during the month and does not mean every property or neighborhood increased in value by 3%.
🔻 Down 2% year-over-year
Closed sales dipped slightly compared with August 2025.
With 1,112 transactions completed during the month, activity remains substantial, but the 2% decline suggests the increasingly limited supply of available homes may be constraining the number of transactions that can take place.
It is also a reminder that tighter inventory does not automatically translate into higher sales volume.
🔻 Down 24% year-over-year
Inventory remains one of the most significant stories in Palm Beach County.
There were 24% fewer single-family homes available for sale than there were in August 2025, considerably reducing the number of options available to buyers.
This decline is helping keep the market competitive, particularly for homes that are well-priced and in desirable locations.
📈 Up 2% year-over-year
Pending sales edged 2% higher.
While the increase is relatively modest, it provides a slightly more positive forward-looking indicator than August’s closed sales figure.
With pending activity holding up despite significantly reduced inventory, buyer demand remains present across the county.
🔻 Down 33% year-over-year
Palm Beach County had just 3.5 months of single-family home inventory available in August — a substantial 33% decrease from last year.
That puts the single-family sector firmly on the seller-favored side of the market.
Buyers have fewer choices, while sellers face considerably less competition from other available properties than they did a year ago.
🔻 Down 13% year-over-year
Homes sold faster in August, with days on market falling 13% to 40 days.
This is particularly notable given that closed sales were slightly lower. While fewer transactions were completed overall, properties that did sell moved more quickly than they did last year.
For sellers, that reinforces the advantage of presenting a home well and pricing it appropriately from the outset.
🔻 Down 7% year-over-year
New listings declined 7%, adding further pressure to an already limited supply of available homes.
With fewer properties entering the market and active inventory already down 24%, there has been little opportunity for buyers’ choices to rebuild.
If new listing activity remains subdued, inventory will be an important number to watch over the coming months.
Palm Beach County’s single-family market currently offers considerably less choice than it did a year ago.
With active inventory down 24%, months of supply at just 3.5, and homes selling 13% faster, buyers should be prepared when an attractive, appropriately priced property becomes available.
That does not mean every listing requires an immediate offer or that buyers have no negotiating power. Pricing, condition, location, and how long an individual property has been on the market still matter.
Being prepared with financing and a clear understanding of recent comparable sales can make a significant difference.
The supply side of August’s market is favorable for sellers.
There are substantially fewer competing homes available, months of inventory has fallen by one-third, and properties are selling faster than they were last year.
However, closed sales were down 2%, so limited inventory should not be mistaken for unlimited demand.
Buyers remain attentive to value, making accurate pricing and strong presentation important even in a seller-favored market.
For investors, Palm Beach County’s limited single-family inventory continues to make property selection particularly important.
Reduced supply can support long-term scarcity, but investors should avoid assuming that every property will benefit equally.
Purchase price, financing costs, insurance, property taxes, maintenance expenses and realistic rental income all need to be considered when evaluating individual opportunities.
Palm Beach County’s August 2026 single-family home market was defined primarily by tightening supply rather than accelerating sales volume.
Active inventory fell 24% year-over-year, months of supply dropped 33% to just 3.5 months, and new listings declined 7%. Homes that sold also moved faster, with days on market falling 13%.
At the same time, the median sale price increased a relatively modest 3%, closed sales declined 2%, and pending sales increased 2%.
Taken together, the numbers point to a seller-favored but still price-conscious market. Buyers have fewer properties to choose from, but they are not simply purchasing everything that becomes available.
As we move toward the final months of 2026, whether new listings remain subdued — and how that affects Palm Beach County’s already limited inventory — will be one of the most important trends to watch.

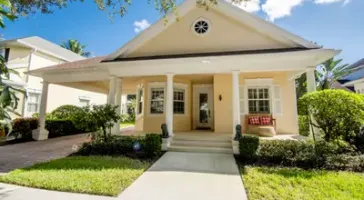
3 Beds | 2 Baths
Contact Andrew at ..
Offered at $1,350,000
More Info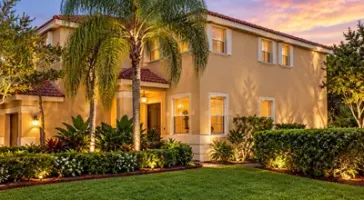
5 Beds | 3 Baths
Contact Iryna at ..
Offered at $1,275,000
More Info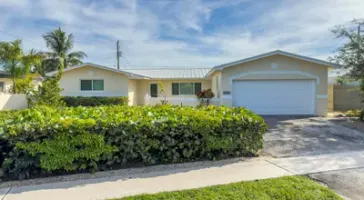
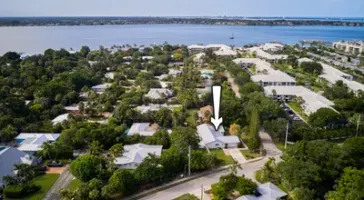
4 Beds | 2 Baths
Contact Allison at ..
Offered at $640,000
More Info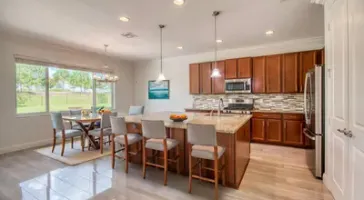









or Create your MyHomes account today?

In only 30 seconds you will have full access to property, community info and SOLD data you can't get anywhere else.