Get Email Updates
Get an email the instant your dream home hits the market with your MyLogin account
Updated September 16, 2026 10:54AM EST



18 FEB
Martin County opened 2026 with a fascinating mix of numbers: prices adjusted sharply, but sales and pending contracts surged. That combination tells an important story — this is not a slow market. It’s a market that reset on price and re-accelerated on activity.
Let’s break it down.
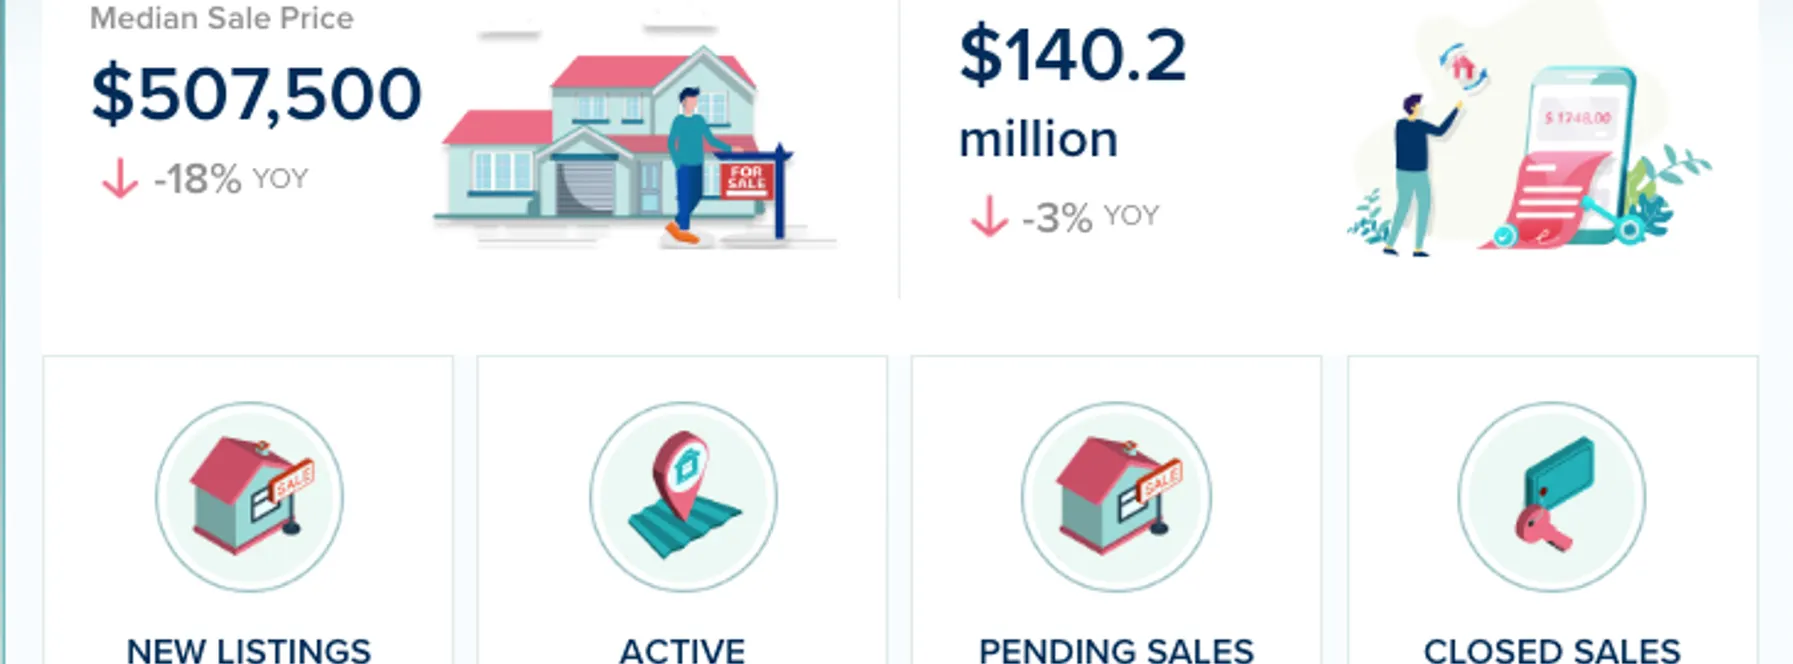
Median Sale Price: $507,500
🔻 Down 18% year-over-year
This is a significant drop in median price, and it likely reflects a shift in the mix of homes sold (fewer luxury closings compared to last January). It does not align with the strength we’re seeing in sales volume — which suggests this is more of a pricing realignment than a demand collapse.
Closed Sales: 148 homes
📈 Up 29% year-over-year
A nearly 30% jump in closings is a major signal of buyer activity. Homes are selling — and at a much faster pace than last year in terms of volume.
Active Inventory: 952 homes
📈 Up 7% year-over-year
Inventory has grown moderately, giving buyers more options. This helps explain some of the pricing softness — more supply equals more negotiating room.
Pending Sales: 238 contracts
📈 Up 18% year-over-year
This is the key forward-looking stat. Buyers are actively signing contracts, meaning February and March could be very strong months.
Months of Inventory: 5.4 months
⏸️ No change year-over-year
The market remains balanced. Even with the price shift, supply and demand are still aligned.
Days on Market: 52 days
⏸️ No change year-over-year
Homes are taking the same amount of time to sell as last January. That stability supports the idea that this is not a distressed market — just a recalibrated one.
New Listings: 344
📈 Up 6% year-over-year
More sellers are entering the market, likely responding to the spike in closed and pending sales.
Buyers:
This may be one of the best windows you’ve had in a while. Prices adjusted, inventory is up, and activity is strong. If you’ve been waiting for leverage — this could be it.
Sellers:
The market is active — but pricing strategy matters more than ever. Buyers are clearly present, but they’re shopping smart and negotiating harder.
Investors:
With prices pulling back but contracts rising sharply, this could present real opportunity — especially for value-focused acquisitions.
Martin County’s January numbers show a market that rebalanced and re-energized at the same time. Activity is strong, demand is present, and the foundation remains solid.
The story isn’t slowdown — it’s adjustment.


7 Beds | 6/2 Baths
Contact Devin at 301.602.1172
Offered at $49,500,000
More Info
6 Beds | 6/1 Baths
Contact Fernando at 786.252.4552
Offered at $9,800,000
More Info
5 Beds | 6/1 Baths
Contact Lourdes at 954.738.5322
Offered at $9,799,000
More Info

5 Beds | 6/1 Baths
Contact Nelson at 305.674.4040
Offered at $8,500,000
More Info








or Create your MyHomes account today?

In only 30 seconds you will have full access to property, community info and SOLD data you can't get anywhere else.