Get Email Updates
Get an email the instant your dream home hits the market with your MyLogin account
Updated August 17, 2026 12:01PM EST



18 FEB
Indian River County kicked off 2026 with some of the most dramatic numbers we’ve seen this cycle. Prices are up, sales have surged, inventory has expanded sharply, and contracts are climbing fast. This is a market experiencing both growth and expansion at the same time.
Let’s unpack it.
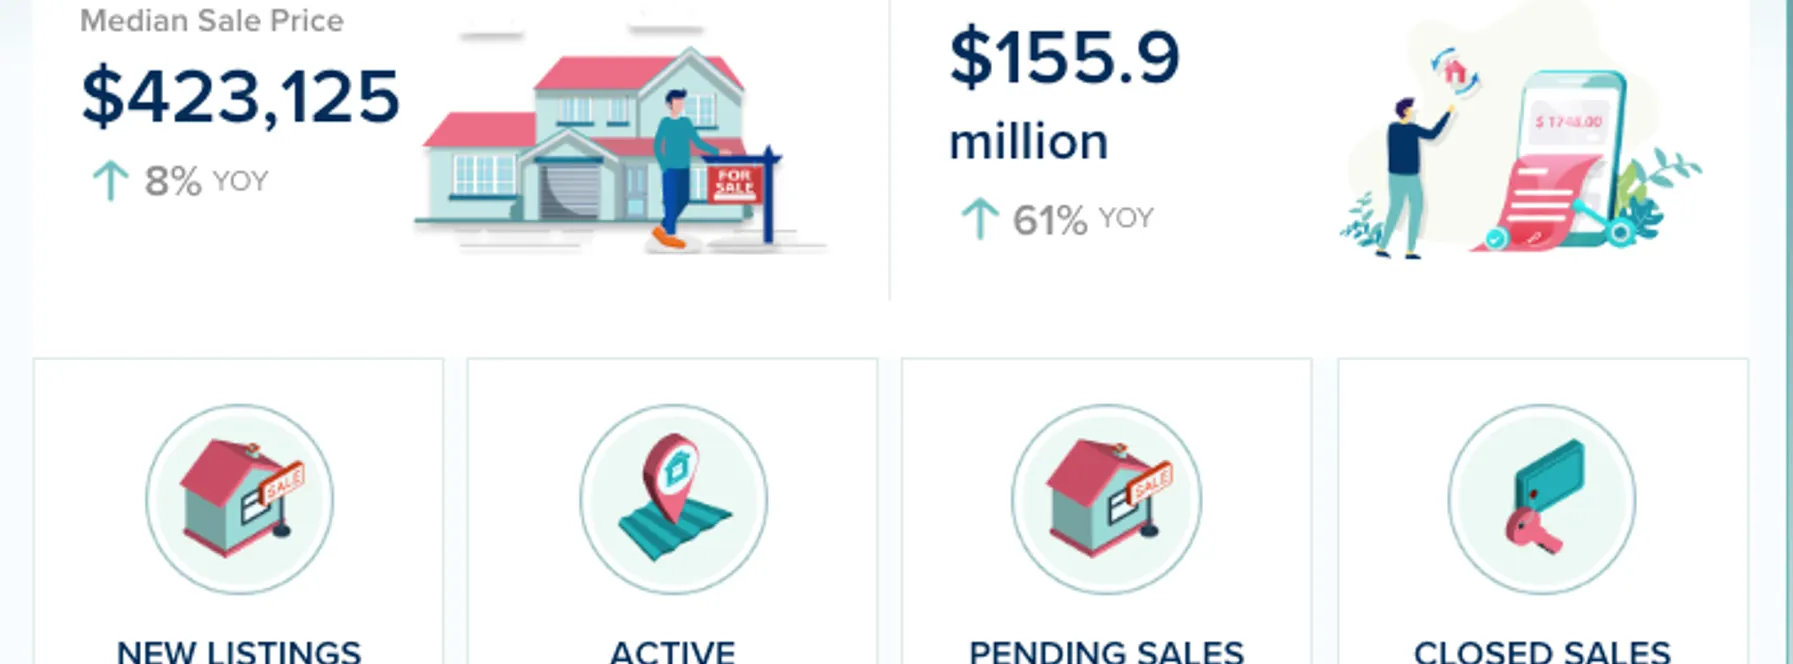
Median Sale Price: $423,125
📈 Up 8% year-over-year
That’s a strong appreciation number. Despite rising inventory, prices climbed — showing there is still real demand supporting values.
Closed Sales: 256 homes
📈 Up 50% year-over-year
A 50% increase in closed sales is significant. That’s not just a seasonal bounce — it reflects a serious rise in buyer activity.
Active Inventory: 1,863 homes
📈 Up 42% year-over-year
Inventory has expanded dramatically. Buyers now have far more options than they did last January, shifting negotiating power slightly toward purchasers.
Pending Sales: 377 contracts
📈 Up 42% year-over-year
Contracts surged right alongside inventory and sales. This is a clear sign that the market is not slowing — it’s scaling up.
Months of Inventory: 8.1 months
📈 Up 35% year-over-year
At over 8 months of supply, Indian River is firmly in buyer-favored territory. This gives buyers leverage, especially in mid- and upper-price points.
Days on Market: 64 days
📈 Up 23% year-over-year
Homes are taking longer to sell, consistent with the increase in available inventory. Buyers are being selective and negotiating more deliberately.
New Listings: 646
📈 Up 64% year-over-year
This is a massive jump in new listings. Sellers clearly entered the market aggressively to start the year — possibly anticipating strong seasonal demand.
Buyers:
You have options — a lot of them. Inventory is up sharply, and months of supply favor negotiation. This is a strategic buying window, especially before spring activity absorbs some of that inventory.
Sellers:
Demand is strong — but so is competition. Pricing correctly is critical. The market will reward homes that stand out, but overpricing will be punished quickly in an 8-month supply environment.
Investors:
This is one of the most dynamic shifts we’ve seen. Rising prices combined with sharply higher inventory creates selective opportunity — especially for buyers targeting motivated sellers.
Indian River County is expanding into 2026 with volume, energy, and inventory growth. The market isn’t slowing — it’s broadening. With strong sales and strong supply, this is shaping up to be a highly competitive and strategic year.

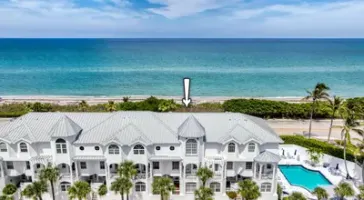
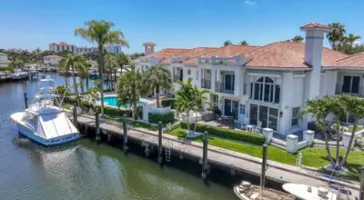
3 Beds | 3/1 Baths
Contact Charles at ..
Offered at $2,700,000
More Info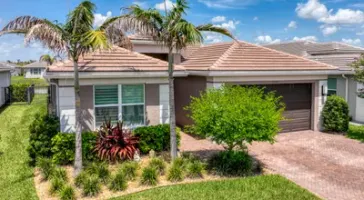
3 Beds | 3 Baths
Contact Andrew at ..
Offered at $650,000
More Info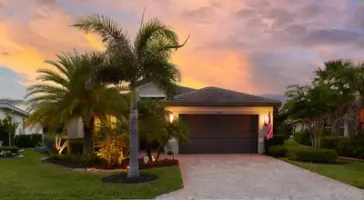
3 Beds | 2/1 Baths
Contact Susan at ..
Offered at $649,990
More Info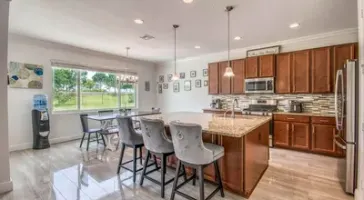








or Create your MyHomes account today?

In only 30 seconds you will have full access to property, community info and SOLD data you can't get anywhere else.