Get Email Updates
Get an email the instant your dream home hits the market with your MyLogin account
Updated October 16, 2026 11:14AM EST



16 OCT
Indian River County’s overall housing market showed an interesting combination of modest price growth, tighter inventory and faster selling times in September 2026, despite a slight decline in completed transactions.
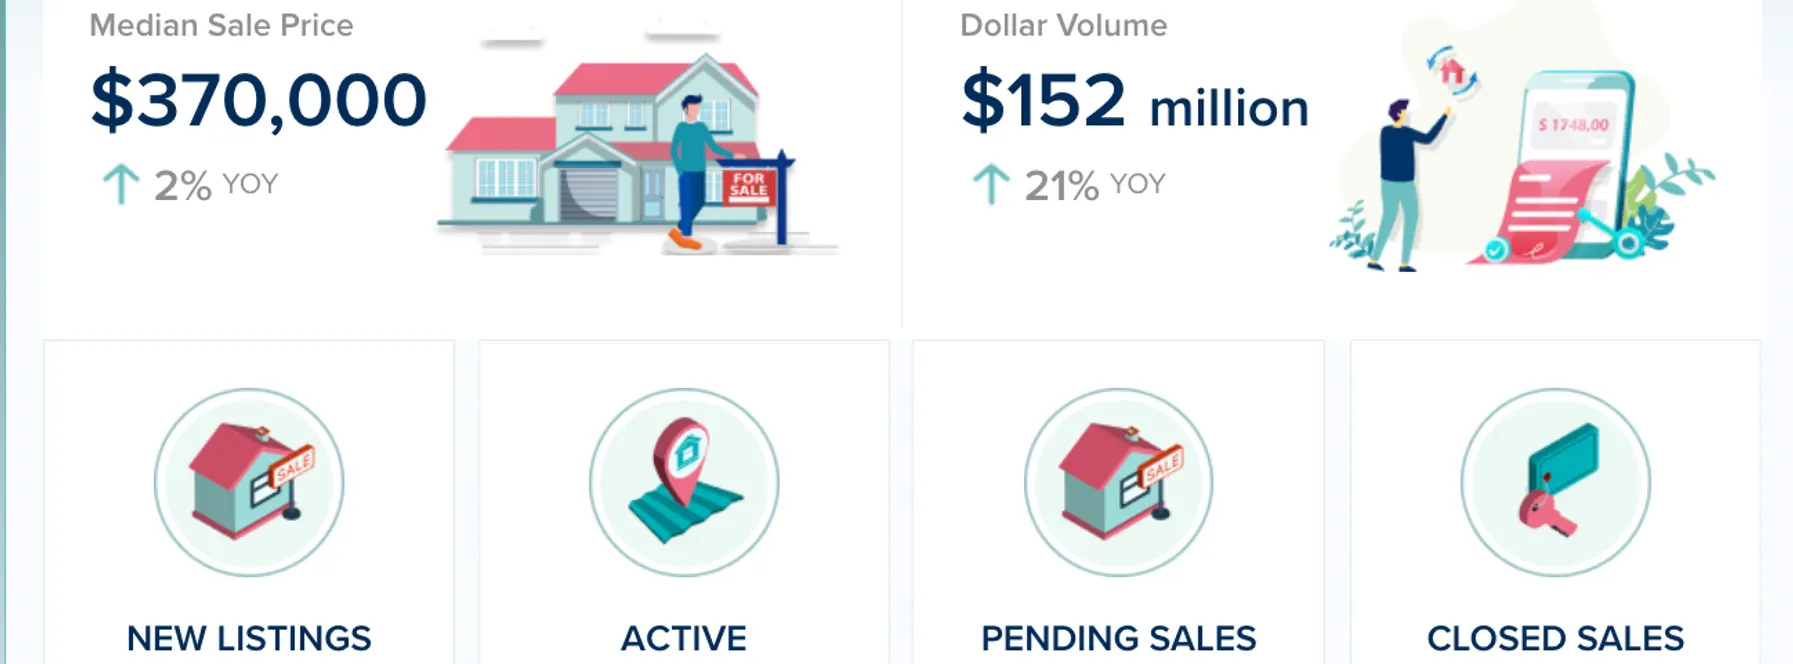
The median sale price across all property types reached $370,000, up 2% year-over-year, while closed sales declined 3%. Active inventory fell 17%, leaving buyers with considerably fewer available properties compared with September 2025.
Interestingly, days on market decreased 24%, indicating that properties completing sales are moving significantly faster than they did a year ago. Pending sales remained unchanged, while new listings declined just 1%.
The biggest story this September is that Indian River County homes are selling considerably faster and overall prices are rising modestly, even though available inventory has fallen significantly.
There are also important differences between property types. Single-family home prices increased 3%, while the median sale price for condos and townhomes declined 11%. Meanwhile, condo and townhome pending sales increased 26%, contrasting with a 6% decline in single-family contracts.
Let’s take a closer look at what the numbers mean for Indian River County buyers, sellers and investors.
📈 Up 2% year-over-year
The median sale price across all Indian River County residential property types reached $370,000 in September, a 2% increase compared with September 2025.
This modest growth suggests that overall median pricing has remained resilient despite slightly fewer completed transactions.
However, the countywide median masks some important differences between property types.
Single-family homes recorded a median sale price of $390,000, up 3%, while condos and townhomes reached $231,500, down 11%.
These contrasting figures highlight why it is important to examine individual market segments rather than relying solely on the overall countywide median.
For buyers, the relatively stable overall median may be encouraging, but opportunities will vary depending on property type, location and price range.
For sellers, it reinforces the importance of evaluating recent comparable sales within their specific neighborhood or community.
It’s also important to remember that the median sale price reflects the mix of properties sold during the month. A 2% increase does not mean that every individual property in Indian River County has appreciated by that amount.
🔻 Down 3% year-over-year
Indian River County recorded 259 closed residential sales in September, representing a 3% decline compared with September 2025.
This suggests that completed transaction activity has remained relatively close to last year’s level.
Single-family closed sales declined 3%, while condo and townhome transactions remained unchanged.
Interestingly, total residential sales dollar volume reached approximately $152 million, an increase of 21% year-over-year.
This is one of the most notable statistics in the report.
Although slightly fewer properties sold, the total value of completed transactions increased substantially.
This suggests that higher-value transactions contributed more to overall dollar volume, although the countywide figures alone do not establish exactly which price segments were responsible.
For buyers and sellers, this highlights the importance of looking beyond the number of completed sales when evaluating market conditions.
The number of transactions may have declined slightly, but the total dollar value of those transactions tells a different story.
🔻 Down 17% year-over-year
Active residential inventory stood at 1,514 properties in September, a 17% decline compared with September 2025.
This is one of the most significant changes in Indian River County’s overall housing statistics.
With considerably fewer properties available, buyers have less choice than they did a year ago.
The reduction has affected both major property sectors, with single-family inventory declining 18% and condo and townhome inventory falling 13%.
Single-family homes accounted for 975 active listings, while condos and townhomes represented 522.
These figures show that both sectors have experienced a meaningful contraction in available supply.
The decline is particularly interesting when considered alongside the 24% reduction in days on market.
For sellers, fewer competing listings can be beneficial, especially when a property is accurately priced and presented effectively.
For buyers, reduced inventory may require greater preparation and flexibility when searching for a home.
However, individual neighborhoods and communities can experience very different supply conditions.
A countywide reduction does not necessarily mean that every property type or price range is experiencing intense buyer competition.
➡️ Unchanged year-over-year
Pending residential sales totaled 291 in September, unchanged compared with September 2025.
This is an encouraging sign of stability, particularly given the decline in available inventory.
Pending sales represent properties that have gone under contract but have not yet completed the closing process.
Because of this, they can provide an indication of potential future transaction activity.
Interestingly, the unchanged countywide figure masks some significant differences between property types.
Single-family pending sales declined 6%, while condo and townhome pending sales increased an impressive 26%.
This suggests that contract activity has shifted somewhat between market segments.
Although fewer single-family homes went under contract, the condo and townhome sector experienced a notable improvement.
However, not every pending transaction ultimately closes, and the timing of completed sales can vary.
For buyers and sellers, the relatively stable overall pending-sales figure suggests that contract activity has held up despite the reduction in available properties.
The key question moving forward will be whether this stability translates into stronger completed sales during the final quarter of 2026.
🔻 Down 25% year-over-year
Months of inventory declined 25% compared with September 2025.
This is one of the largest percentage changes in Indian River County’s overall housing statistics.
Months of inventory measures how long the available supply of properties would take to sell at the prevailing sales pace.
The substantial reduction suggests that supply conditions have tightened considerably over the past year.
This is consistent with the 17% decline in active inventory and relatively stable overall pending-sales activity.
However, supply conditions vary between property types.
Single-family months of inventory declined 24%, while the condo and townhome sector recorded a 30% decrease.
These reductions suggest that both sectors have experienced tighter supply conditions, although the effect on prices has been very different.
Single-family median prices increased 3%, while condo and townhome median prices declined 11%.
This demonstrates that reduced inventory does not automatically translate into higher prices across every market segment.
For sellers, tighter supply may help reduce competition from comparable properties.
For buyers, fewer available options may require greater preparation, but opportunities to negotiate can still exist depending on property condition, pricing and location.
🔻 Down 24% year-over-year
Days on market decreased 24% compared with September 2025.
This is one of the most encouraging indicators in Indian River County’s latest housing report.
Properties that successfully sold spent considerably less time on the market than they did a year ago.
The improvement is particularly interesting because closed sales declined slightly, while pending sales remained unchanged.
Although overall transaction activity has not increased significantly, properties completing sales are moving through the market more quickly.
The improvement has been seen across both major property sectors.
Single-family days on market declined 16%, while condos and townhomes recorded a substantial 46% reduction.
This suggests that faster selling times are affecting the broader market, although the improvement has been particularly pronounced in the condo and townhome sector.
For sellers, the trend reinforces the importance of competitive pricing and effective presentation.
For buyers, it highlights the value of having financing arranged and being ready to make informed decisions when suitable properties become available.
However, faster selling times do not mean every property is selling quickly.
Homes that are overpriced, require significant improvements or face competition from similar listings may still spend extended periods on the market.
The key takeaway is that Indian River County’s overall housing market is moving significantly faster, even though completed sales have declined slightly and pending activity has remained stable.
🔻 Down 1% year-over-year
New residential listings totaled 388 in September, a modest 1% decline compared with September 2025.
This suggests that the flow of new properties entering the market has remained relatively stable.
However, active inventory declined 17%, indicating that the overall number of available properties has contracted substantially.
New listings and active inventory measure different aspects of supply, so their percentage changes do not necessarily move together.
The figures also reveal some interesting differences between property types.
Single-family new listings declined 6%, while condo and townhome listings increased 17%.
These contrasting trends suggest that more attached properties entered the market compared with last year, while fewer single-family homes became available.
For buyers, the relatively stable overall flow of new listings means fresh opportunities continue to appear.
For sellers, it means new competing properties are still entering the market, even as total available inventory declines.
If pending sales remain stable while new listing activity continues at a similar pace, it will be worth monitoring whether inventory begins to rebuild in the coming months.
Indian River County buyers are navigating a market where available inventory has declined significantly, but overall contract activity has remained relatively stable.
Active inventory is down 17%, while days on market have decreased 24%.
These figures suggest that desirable, competitively priced properties may move more quickly than they did a year ago.
However, closed sales have declined 3%, and pending sales are unchanged, indicating that overall transaction activity has not increased substantially.
The experience will also depend heavily on property type.
Single-family buyers are facing tighter inventory and modestly higher median prices, while condo and townhome buyers may find lower median prices but stronger contract activity and faster selling times.
Buyers should focus on individual property values, recent comparable sales and their long-term financial objectives rather than relying solely on countywide trends.
Being financially prepared remains important, but so does taking the time to conduct appropriate inspections and due diligence.
For condominium buyers, reviewing association fees, reserves, insurance and potential special assessments is particularly important.
Indian River County sellers have several encouraging indicators, including a modest increase in the overall median sale price, reduced inventory and significantly faster selling times.
However, the slight decline in closed sales suggests that buyers remain selective.
That means realistic pricing and effective marketing remain essential.
The difference between property types is particularly important.
Single-family sellers may benefit from tighter inventory and modest price growth, while condo and townhome sellers are operating in a market where the median sale price has declined significantly despite stronger pending activity.
Sellers should pay close attention to recent comparable sales within their specific community rather than assuming that overall countywide trends apply equally to every property.
Professional photography, thoughtful preparation, accurate pricing and a strong marketing strategy can help a listing stand out.
For condo and townhome sellers, clear information about association fees, reserves, insurance and potential assessments can also help buyers make informed decisions.
For investors, Indian River County’s September housing statistics present a market with tighter inventory, relatively stable overall transaction activity and significant differences between property sectors.
The overall median sale price increased 2%, suggesting continued price resilience.
Meanwhile, the 21% increase in total sales dollar volume indicates that the value of completed transactions has grown substantially, despite slightly fewer sales.
However, the different pricing trends between single-family homes and condos and townhomes highlight the importance of examining individual market segments.
Investors should be cautious about interpreting countywide price growth as evidence that every property is appreciating.
Individual neighborhoods, property conditions and price ranges can experience very different trends.
Opportunities may still exist, particularly where properties have been listed for extended periods or sellers are motivated to negotiate.
However, financing costs, insurance, property taxes, maintenance, renovation expenses, association fees and potential special assessments should all be considered carefully.
Rental demand, realistic rental income and community restrictions are also important when evaluating investment properties.
A successful investment strategy should focus on property-level fundamentals rather than broad market averages alone.
Indian River County’s September 2026 housing market is showing modest price growth, tighter inventory and significantly faster selling times, despite slightly fewer completed transactions across all property types.
The median sale price increased 2% to $370,000, while closed sales declined 3% to 259 properties.
Active inventory fell 17% to 1,514 properties, and pending sales remained unchanged at 291 contracts.
Meanwhile, days on market declined 24%, months of inventory fell 25%, and new listings decreased just 1% to 388 properties.
Perhaps most notably, total residential sales dollar volume increased 21% to approximately $152 million, despite slightly fewer completed transactions.
Together, these figures suggest a market where reduced supply and higher transaction values are contributing to continued price resilience, even as overall sales activity remains relatively stable.
However, the differences between single-family homes and condos and townhomes remain important.
Single-family median prices increased 3%, while the condo and townhome median declined 11%.
At the same time, condo and townhome pending sales increased 26%, compared with a 6% decline in single-family contracts.
For sellers, reduced inventory and faster selling times offer encouraging conditions, but accurate pricing and effective marketing remain essential.
For buyers, opportunities vary by property type, with tighter conditions in the single-family sector and potentially different negotiating opportunities in condo and townhome communities.
As Indian River County moves into the final quarter of 2026, the key trends to watch will be whether pending sales remain stable, whether inventory continues to tighten and whether faster selling times eventually influence prices across both property sectors.
For now, Indian River County’s overall housing market remains active but selective, creating opportunities for buyers, sellers and investors who understand the importance of local market conditions and individual property values.


7 Beds | 11 Baths
Contact Chad at 305.400.9507
Offered at $34,950,000
More Info
6 Beds | 7/2 Baths
Contact Chad at 305.400.9507
Offered at $29,995,000
More Info
7 Beds | 10/2 Baths
Contact Chad at 305.400.9507
Offered at $26,500,000
More Info
6 Beds | 6/2 Baths
Contact Chad at 305.400.9507
Offered at $18,500,000
More Info
6 Beds | 6/1 Baths
Contact Shai at ..
Offered at $12,900,000
More Info








or Create your MyHomes account today?

In only 30 seconds you will have full access to property, community info and SOLD data you can't get anywhere else.