Get Email Updates
Get an email the instant your dream home hits the market with your MyLogin account
Updated November 16, 2026 10:40AM EST



16 NOV
Indian River County’s overall housing market experienced stable median prices, declining inventory and slower transaction activity in October 2026, while properties took longer to sell compared with the same period last year.
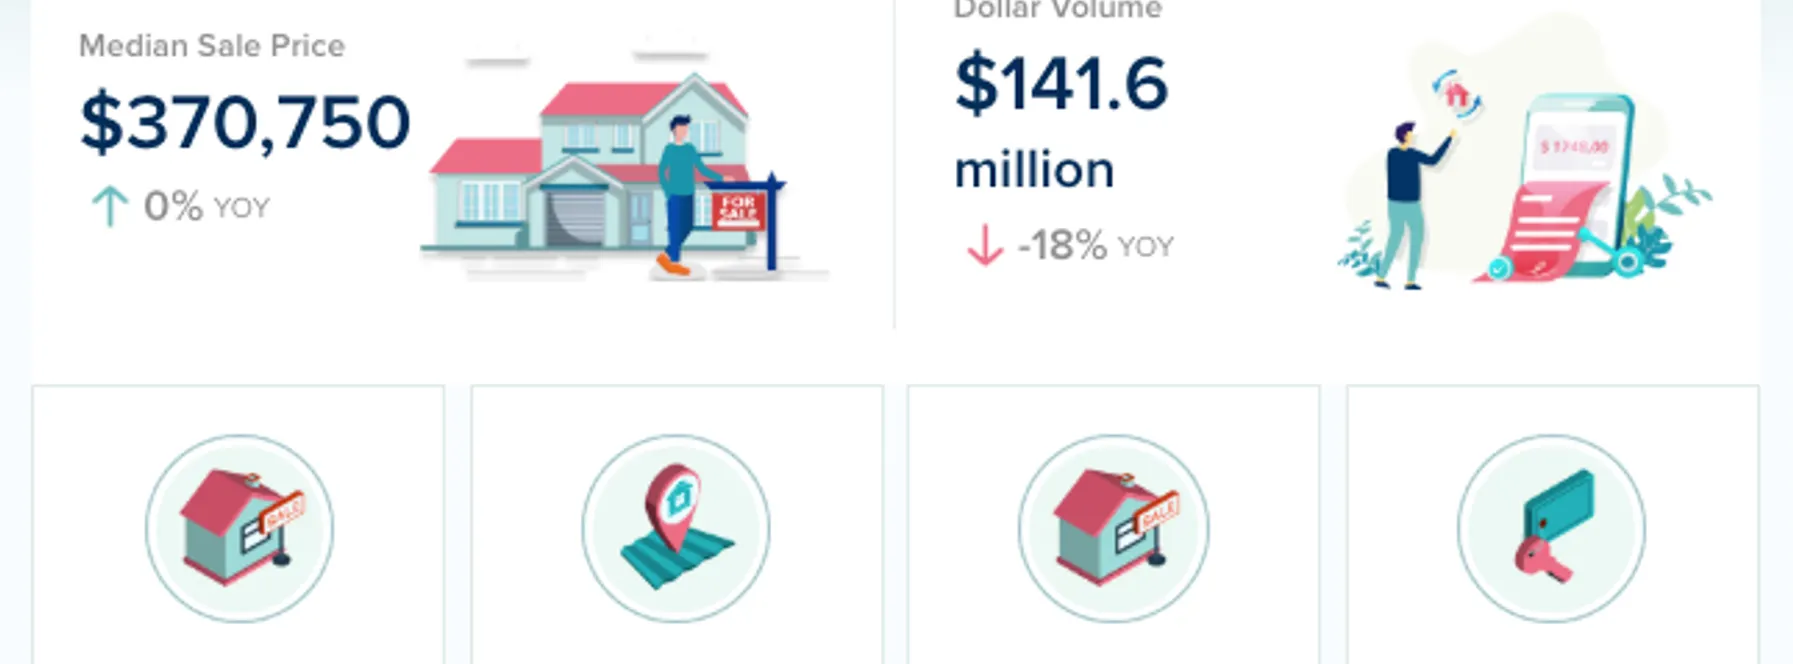
The median sale price across all residential property types reached $370,750, unchanged compared with October 2025. However, closed sales declined 8% to 267 properties, indicating that fewer transactions were completed even as the overall median price held steady.
Active inventory fell 15% to 1,605 properties, while pending sales decreased 9% to 285 contracts. New listings also declined 13% to 427 properties, indicating that fewer homes entered the market compared with the same period last year.
Meanwhile, days on market increased 10%, even as months of inventory declined 22%. This combination highlights the importance of examining supply, pricing and transaction activity together.
The biggest story this October is that Indian River County’s overall median sale price has remained unchanged despite a slowdown in completed transactions, while significant differences have emerged between single-family homes and condos and townhomes.
Single-family median prices increased 4%, while condo and townhome median prices declined 19%.
Total residential sales dollar volume reached approximately $141.6 million, an 18% decline year-over-year.
Let’s take a closer look at what these figures mean for Indian River County buyers, sellers and investors.
➡️ Unchanged year-over-year
The median sale price across all Indian River County residential property types reached $370,750 in October, unchanged compared with October 2025.
This indicates that the overall median price of properties sold remained stable despite softer transaction activity.
However, the countywide figure masks important differences between property types.
Single-family homes recorded a median sale price of $395,000, up 4% year-over-year.
Meanwhile, condos and townhomes reached $222,500, a substantial 19% decline.
These figures demonstrate that the single-family sector experienced stronger median pricing than the attached-home sector.
The unchanged overall median may also reflect changes in the mix of properties sold across different categories and price ranges.
For buyers, stable countywide median pricing may provide some reassurance compared with markets experiencing substantial price increases.
For sellers, the figures reinforce the importance of evaluating recent comparable sales within their specific neighborhood or community.
However, the median sale price reflects the middle price of properties sold during the month.
An unchanged median does not mean every individual property has maintained exactly the same value.
Individual homes, buildings and communities may have experienced very different pricing trends.
🔻 Down 8% year-over-year
Indian River County recorded 267 closed residential sales in October, representing an 8% decline compared with October 2025.
This indicates that overall completed transaction activity has softened.
The reduction was evident across both major property sectors.
Single-family closed sales declined 7% to 200 homes, while condo and townhome sales fell 11% to 65 properties.
These figures suggest that fewer transactions were completed across the broader market.
Total residential sales dollar volume reached approximately $141.6 million, an 18% decline year-over-year.
Interestingly, dollar volume declined more sharply than completed sales.
This indicates that the total value of completed transactions weakened more significantly than transaction counts alone would suggest.
Changes in the mix of properties sold, including the relative contribution of higher-priced transactions, may have influenced this difference.
However, the countywide figures do not identify which specific property categories or price ranges were responsible.
For buyers and sellers, the figures demonstrate that countywide averages can conceal important differences in market activity.
🔻 Down 15% year-over-year
Active residential inventory stood at 1,605 properties in October, a 15% decline compared with October 2025.
This represents a meaningful reduction in the number of available properties.
With fewer homes on the market, buyers have less choice than they did a year ago.
Interestingly, the reduction was identical across the two major property sectors.
Single-family inventory declined 15% to 1,013 homes, while condo and townhome inventory also fell 15% to 576 properties.
Despite these matching declines, the pricing outcomes were very different.
Single-family median prices increased 4%, while condo and townhome median prices declined 19%.
This demonstrates that inventory changes alone cannot explain the direction of median prices.
For sellers, fewer competing listings may create a more favorable environment, particularly when properties are priced accurately.
For buyers, reduced inventory may require greater preparation and flexibility.
However, the increase in overall days on market suggests that fewer available properties have not automatically translated into faster sales.
Understanding local inventory and recent comparable sales remains essential when evaluating buying or selling opportunities.
🔻 Down 9% year-over-year
Pending residential sales totaled 285 in October, a 9% decline compared with October 2025.
This is an important indicator in Indian River County’s overall housing report.
Pending sales represent properties that have gone under contract but have not yet completed the closing process.
Because of this, they can provide an indication of potential future transaction activity.
The decline suggests that fewer buyers entered into contracts compared with the same period last year.
The reduction was evident across both major property sectors.
Single-family pending sales fell 10%, while condo and townhome pending sales declined 6%.
These figures indicate that softer contract activity is affecting the broader market, although the reduction was more pronounced in the single-family sector.
However, pending sales are not guaranteed future closings, and the timing of completed transactions can vary.
For sellers, the decline reinforces the importance of realistic pricing and understanding buyer expectations.
For buyers, softer contract activity may provide opportunities to negotiate, particularly on properties that have remained available for longer periods.
The key question moving forward will be whether pending sales begin to recover as Indian River County enters its winter selling season.
🔻 Down 22% year-over-year
Months of inventory declined 22% compared with October 2025.
This statistic measures how long the available supply of properties would take to sell at the prevailing sales pace.
The reduction indicates that Indian River County’s overall reported supply measure has tightened over the past year.
This is consistent with the 15% decline in active inventory.
However, the reduction is particularly interesting because closed and pending sales have also declined.
Despite softer transaction activity, the reported months-of-inventory measure has fallen.
The trend was evident across both major property sectors.
Single-family months of inventory declined 19%, while condo and townhome months of inventory fell 30%.
These figures suggest that the reported supply measure tightened more significantly in the condo and townhome sector.
However, the 10% increase in overall days on market indicates that properties completing sales are taking longer.
This demonstrates why months of inventory should always be considered alongside other market indicators.
A lower months-of-inventory figure does not automatically establish that every neighborhood favors sellers.
Without the absolute months-of-inventory figure, it is not possible to determine the overall balance between buyers and sellers from the percentage change alone.
📈 Up 10% year-over-year
Days on market increased 10% compared with October 2025.
This indicates that properties completing sales spent more time on the market than they did a year ago.
However, the overall increase masks important differences between property types.
Single-family days on market declined 5%, while condo and townhome days on market increased 21%.
These figures suggest that selling conditions have diverged significantly between the two sectors.
The overall increase is particularly interesting because active inventory declined 15% and months of inventory fell 22%.
Despite fewer available properties, completed sales are taking longer.
This demonstrates that reduced supply does not necessarily guarantee faster transactions.
Changes in the mix of properties sold, pricing expectations or buyer preferences may have influenced the result.
However, the countywide figures do not establish exactly what caused the increase.
For sellers, longer selling times reinforce the importance of accurate pricing and effective presentation.
For buyers, the increase may create opportunities to negotiate on properties that have remained available.
Nevertheless, the experience can vary significantly by property type and community.
The key takeaway is that Indian River County’s overall housing market is experiencing longer selling times, with the condo and townhome sector contributing a particularly notable contrast to the single-family market.
🔻 Down 13% year-over-year
New residential listings totaled 427 in October, a 13% decline compared with October 2025.
This indicates that fewer properties entered the market during the month.
The reduction was relatively similar to the 15% decline in active inventory.
However, new listings and active inventory measure different aspects of supply.
New listings represent properties entering the market during a particular period, while active inventory represents properties available at a given point.
The figures also reveal significant differences between property types.
Single-family new listings declined 4% to 295 homes, while condo and townhome listings fell 29% to 131 properties.
These figures indicate that new supply entering the condo and townhome sector contracted much more sharply.
For buyers, reduced new listing activity may mean fewer fresh opportunities to consider.
For sellers, fewer newly listed competing properties can be beneficial.
However, the 9% decline in pending sales and 10% increase in days on market suggest that softer transaction activity and longer selling times remain important considerations.
As the winter selling season progresses, it will be worth monitoring whether new listings recover and how that affects available inventory.
Indian River County buyers are navigating a market where overall median prices have remained stable, inventory has tightened and transaction activity has softened.
The median sale price remained unchanged at $370,750, while active inventory declined 15%.
Meanwhile, closed sales decreased 8%, and pending sales fell 9%.
These figures suggest that buyers may have opportunities to negotiate, particularly on properties that have remained available for longer periods.
However, the experience will depend heavily on property type.
Single-family buyers are seeing higher median prices and slightly faster selling times.
Meanwhile, condo and townhome buyers are experiencing significantly lower median prices and longer selling times.
The 19% decline in condo and townhome median price may create opportunities worth exploring, although it does not establish that every individual property has declined by that amount.
Buyers should focus on recent comparable sales and the full cost of ownership rather than relying solely on countywide trends.
For condominium buyers, reviewing association fees, reserves, insurance and potential special assessments remains particularly important.
Indian River County sellers are operating in a market where overall median prices have remained stable but transaction activity has declined.
Reduced inventory offers some encouraging conditions, although the overall increase in days on market suggests that selling may require greater patience.
The differences between property types are particularly important.
Single-family sellers are seeing higher median prices and slightly faster selling times.
Meanwhile, condo and townhome sellers are facing significantly lower median prices and longer selling times.
Both sectors have experienced declines in pending contract activity.
This means realistic pricing and effective marketing remain essential.
Sellers should evaluate recent comparable sales within their specific neighborhood or community rather than assuming that countywide trends apply equally to every property.
Professional photography, thoughtful preparation and a strong marketing strategy can help a listing stand out.
For condo and townhome sellers, clear information about association fees, reserves, insurance and potential assessments can also help buyers make informed decisions.
For investors, Indian River County’s October housing statistics present a market with stable overall median prices, reduced inventory and softer transaction activity.
The unchanged overall median sale price suggests that countywide pricing has remained relatively stable.
However, the 18% reduction in total sales dollar volume and 9% decline in pending sales indicate that overall market activity has weakened.
The contrast between single-family homes and condos and townhomes highlights the importance of examining individual property sectors.
Single-family median prices increased 4%, while condo and townhome median prices declined 19%.
Investors should avoid interpreting countywide price stability as evidence that every property is experiencing the same trend.
Individual neighborhoods, property conditions and price ranges can vary significantly.
Opportunities may exist where properties have been listed for extended periods or sellers are motivated to negotiate.
However, financing costs, insurance, property taxes, maintenance, renovation expenses, association fees and potential special assessments should all be considered carefully.
Rental demand, realistic rental income and community restrictions are also important when evaluating investment properties.
A successful investment strategy should focus on property-level fundamentals rather than broad market averages alone.
Indian River County’s October 2026 housing market is showing stable overall median prices, tighter inventory and longer selling times, despite a reduction in completed transactions and pending contracts.
The median sale price remained unchanged at $370,750, while closed sales declined 8% to 267 properties.
Active inventory decreased 15% to 1,605 properties, and pending sales fell 9% to 285 contracts.
Meanwhile, days on market increased 10%, months of inventory fell 22%, and new listings decreased 13% to 427 properties.
Total residential sales dollar volume declined 18% to approximately $141.6 million.
Together, these figures suggest a market where reduced supply is accompanying stable overall median pricing but softer transaction activity and longer selling times.
However, the differences between property types remain important.
Single-family median prices increased 4% to $395,000, while condo and townhome median prices declined 19% to $222,500.
At the same time, single-family closed sales fell 7%, compared with an 11% decline in condo and townhome transactions.
Single-family homes recorded slightly faster selling times, while condos and townhomes experienced a substantial increase in days on market.
For sellers, reduced inventory offers some encouraging conditions, but accurate pricing and effective marketing remain essential.
For buyers, stable overall median prices may be reassuring, although conditions vary significantly by property type and neighborhood.
As Indian River County moves toward the end of 2026, the key trends to watch will be whether pending sales recover, whether inventory continues to tighten and whether the differences between single-family homes and condos and townhomes persist.
For now, Indian River County’s overall housing market remains active but selective, creating opportunities for buyers, sellers and investors who understand the importance of local market conditions and individual property values.


7 Beds | 6/2 Baths
Contact Devin at 301.602.1172
Offered at $49,500,000
More Info
7 Beds | 8/1 Baths
Contact James at ..
Offered at $35,000,000
More Info
6 Beds | 7/2 Baths
Contact Steven at ..
Offered at $21,900,000
More Info
7 Beds | 7/1 Baths
Contact William at 305.345.2023
Offered at $19,450,000
More Info
5 Beds | 4 Baths
Contact Laura at 305.753.8681
Offered at $15,900,000
More Info








or Create your MyHomes account today?

In only 30 seconds you will have full access to property, community info and SOLD data you can't get anywhere else.