Get Email Updates
Get an email the instant your dream home hits the market with your MyLogin account
Updated September 16, 2026 10:54AM EST



17 AUG
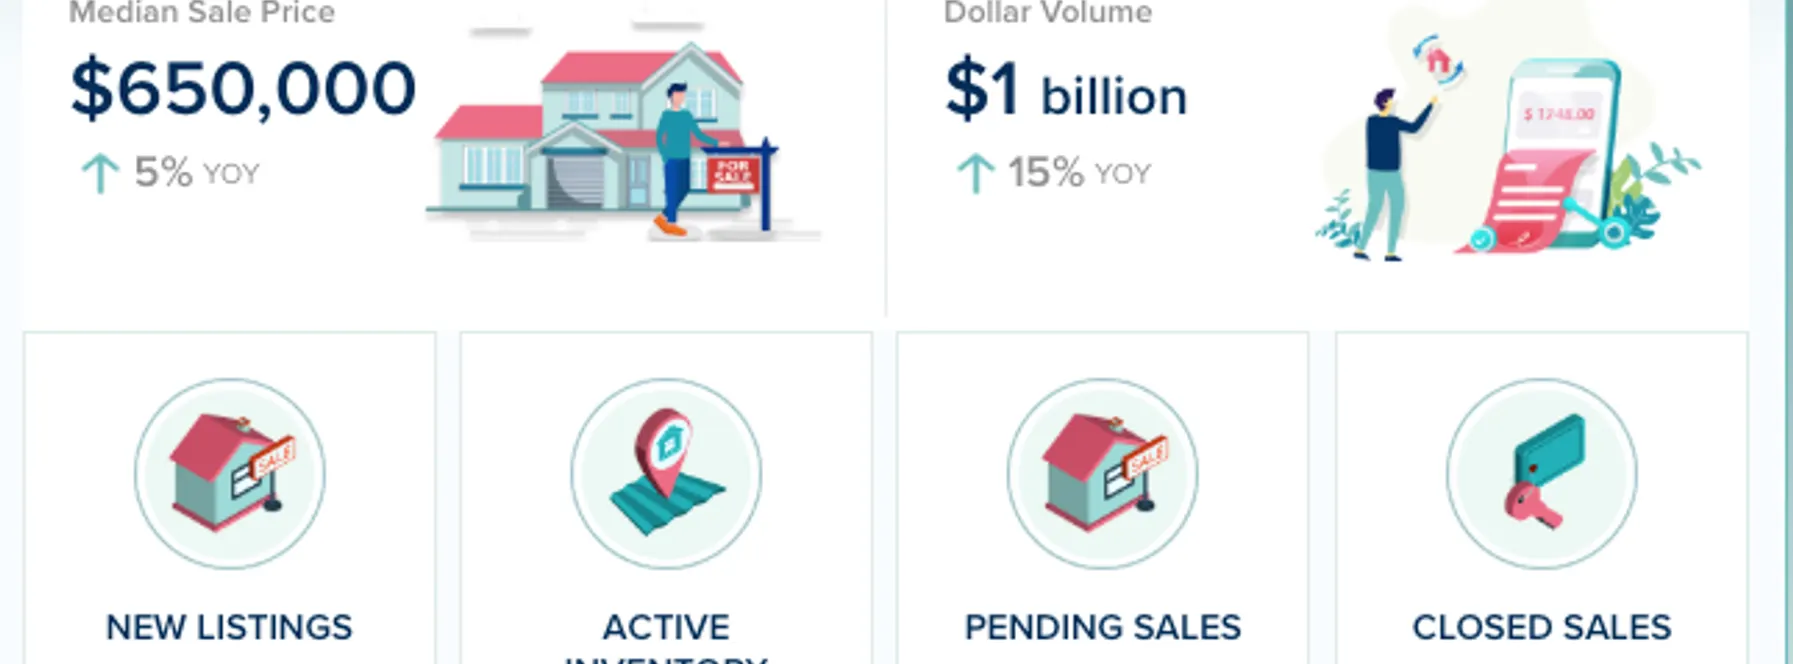
Broward County’s single-family home market showed considerable strength in July, with prices rising, more homes selling, inventory falling sharply, and properties moving much faster than they did a year ago.
The combination is particularly notable: active inventory fell 25% while closed sales increased 8% and homes sold 21% faster than last July. With just 4.3 months of supply available, Broward County’s single-family market has become considerably tighter.
Let’s take a closer look.
📈 Up 5% year-over-year
The median sale price increased to $650,000, representing healthy appreciation compared with last July.
With significantly fewer homes available and buyer activity remaining strong, limited supply continues to provide support for single-family home values throughout Broward County.
📈 Up 8% year-over-year
More single-family homes sold than during the same month last year, demonstrating continued buyer confidence despite higher prices and fewer properties to choose from.
The combination of rising sales and falling inventory is a particularly strong indicator of current demand.
🔻 Down 25% year-over-year
This is one of July’s most important statistics.
There were one-quarter fewer single-family homes available for sale than there were a year ago, significantly reducing the choices available to buyers.
📈 Up 5% year-over-year
Pending sales also increased, indicating that buyer demand remains healthy and suggesting continued sales activity as we move through the second half of the year.
🔻 Down 28% year-over-year
The supply of available single-family homes has tightened substantially.
At 4.3 months of inventory, Broward County is operating below the level typically associated with a balanced market, creating seller-favored conditions in many neighborhoods and price ranges.
🔻 Down 21% year-over-year
Homes are selling considerably faster than they were last July.
At just 34 days on market, Broward County has one of the faster-moving single-family markets in South Florida, reinforcing the impact of reduced inventory and continued buyer demand.
🔻 Down 8% year-over-year
Fewer new single-family homes entered the market compared with July 2025.
With sales increasing while fewer new listings are coming onto the market, there is little opportunity for overall inventory to rebuild, contributing to the continued tightening of supply.
Broward County has become considerably more competitive for single-family home buyers.
Inventory is down 25%, homes are selling 21% faster, and pending sales continue to increase. Buyers who find a well-priced home that meets their needs should therefore be prepared to act.
That doesn’t mean every property will generate immediate competition. Location, condition, pricing, and individual neighborhood dynamics still matter, making local comparable sales especially important when deciding what to offer.
July’s statistics provide a strong backdrop for homeowners considering selling.
Prices are up, closed and pending sales have increased, inventory is substantially lower, and homes are selling faster than they were a year ago.
With fewer competing listings available, sellers who price and market their homes effectively are entering the market from a favorable position.
Broward County continues to offer strong long-term fundamentals for residential real estate investors. Limited supply, continued buyer activity, and rising home values reinforce the desirability of the county’s single-family housing market.
As always, individual property economics — including purchase price, insurance, taxes, maintenance, financing, and realistic rental income — remain critical when evaluating an investment.
July’s statistics show a tighter, faster-moving Broward County single-family housing market than we saw a year ago.
The median sale price increased 5%, closed sales rose 8%, and pending sales increased 5%. At the same time, active inventory fell by a substantial 25%, and homes sold 21% faster.
Perhaps the clearest indication of how much conditions have changed is months of inventory, which dropped 28% to just 4.3 months.
For buyers, reduced supply means preparation and timing are increasingly important. For sellers, less competition and healthy buyer demand continue to create favorable conditions.
As we move through the second half of 2026, inventory remains the key number to watch in Broward County’s single-family home market.


3 Beds | 3/1 Baths
Contact Charles at ..
Offered at $2,499,000
More Info
3 Beds | 2/1 Baths
Contact Andrea at ..
Offered at $1,600,000
More Info
3 Beds | 2 Baths
Contact Jonathan at ..
Offered at $899,000
More Info
2 Beds | 2 Baths
Contact David at ..
Offered at $414,890
More Info








or Create your MyHomes account today?

In only 30 seconds you will have full access to property, community info and SOLD data you can't get anywhere else.