Get Email Updates
Get an email the instant your dream home hits the market with your MyLogin account
Updated September 16, 2026 10:54AM EST



17 AUG
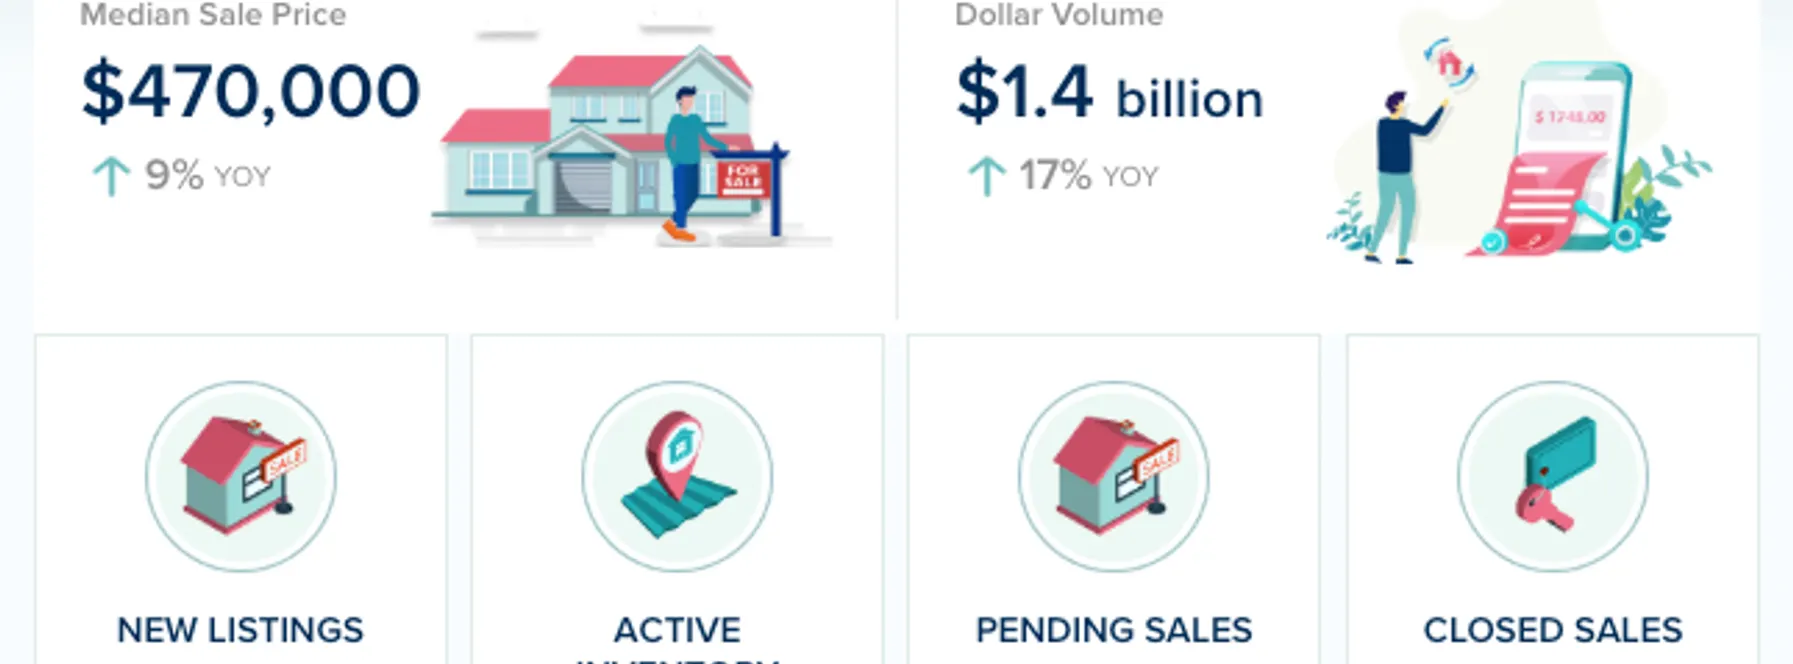
Broward County’s overall residential real estate market continued to tighten in July, with the median sale price rising, closed sales edging higher, and substantially fewer properties available than a year ago. However, the combined numbers also reveal a market with distinct conditions depending on whether you’re looking at single-family homes or condos and townhomes.
Across all residential property types, the headline is a 9% increase in the median sale price alongside a 19% decline in active inventory. Yet with seven months of overall inventory remaining, buyers still have meaningful choice — largely driven by the county’s condo and townhome supply.
Let’s take a closer look.
📈 Up 9% year-over-year
The median sale price across all residential properties increased significantly compared with July 2025.
Because this figure combines single-family homes, condos, and townhomes, the mix of properties sold during the month can have a meaningful impact on the overall median. It shouldn’t be interpreted as meaning every Broward County property has appreciated by 9%.
Still, the increase contributes to a broader picture of resilient home values across the county.
📈 Up 2% year-over-year
Overall sales activity increased modestly compared with last July.
Underneath that combined number, however, the market is divided: single-family home sales increased while condo and townhome sales softened slightly.
That makes property type increasingly important when evaluating current Broward County market conditions.
🔻 Down 19% year-over-year
There were nearly one-fifth fewer residential properties available for sale than there were a year ago.
This is a substantial decline in supply and one of the most important changes in Broward County’s overall housing market.
However, inventory isn’t distributed evenly. Single-family home supply is considerably tighter than condo and townhome supply.
⏸️ Unchanged year-over-year
Pending sales were flat compared with July 2025, suggesting overall buyer activity remains relatively steady.
Again, the underlying sectors differ, with single-family pending sales increasing while condo and townhome pending sales declined.
🔻 Down 21% year-over-year
Overall residential supply has tightened considerably compared with last year, falling by more than one-fifth.
At seven months of inventory, however, the combined Broward County market still provides buyers with a relatively healthy selection of properties.
The property-type distinction is particularly important here: single-family homes had just 4.3 months of supply, compared with 10 months for condos and townhomes.
⏸️ Unchanged year-over-year
Across all residential properties, selling times were unchanged from last July.
But the overall figure masks substantial differences between property types. Single-family homes are selling much faster than last year, while condos and townhomes are taking considerably longer.
Buyers and sellers should therefore pay closer attention to their specific market segment rather than relying solely on the countywide average.
🔻 Down 10% year-over-year
Fewer new properties entered the Broward County market compared with July 2025.
With new listings falling alongside overall active inventory, the supply of available homes continues to contract.
The Broward County market currently offers very different experiences depending on what you’re buying.
Single-family home buyers face limited inventory and faster-moving properties, while condo and townhome buyers generally have substantially more selection and negotiating room.
Understanding the statistics for your particular property type, neighborhood, community, and price range is therefore much more valuable than relying solely on countywide numbers.
Overall market conditions remain encouraging, with prices higher, inventory lower, and slightly more completed sales than a year ago.
However, sellers need to understand their individual market segment.
Single-family homeowners are benefiting from particularly tight supply, while condo and townhome sellers face greater competition and more selective buyers. Pricing and presentation should reflect those differences.
Broward County continues to provide opportunities across a wide variety of residential property types.
The condo market may offer opportunities for buyers seeking negotiating leverage, while tight single-family inventory continues to support that sector’s longer-term fundamentals.
In either case, investors should carefully evaluate insurance, taxes, HOA expenses where applicable, assessments, maintenance, rental restrictions, financing, and realistic rental income.
July’s numbers show a Broward County residential market that has tightened significantly compared with a year ago, but remains highly segmented by property type.
The overall median sale price increased 9%, closed sales rose 2%, and active inventory fell 19%. Months of inventory also declined 21%, although seven months of supply remain available across the combined market.
The most important story sits beneath those overall numbers.
Broward County’s single-family market is relatively tight and fast-moving, with rising sales and substantially lower inventory. The condo and townhome market offers far more supply, with softer sales activity and longer selling times.
For buyers and sellers alike, that means the question isn’t simply “How is the Broward County real estate market?” It’s “How is the market for my specific type of property?”
That distinction will be increasingly important as we move through the second half of 2026.


3 Beds | 3/1 Baths
Contact Charles at ..
Offered at $2,499,000
More Info
3 Beds | 2/1 Baths
Contact Andrea at ..
Offered at $1,600,000
More Info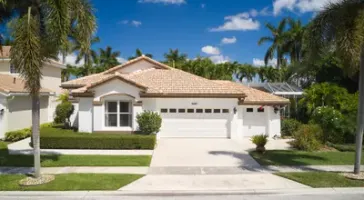
3 Beds | 2 Baths
Contact Jonathan at ..
Offered at $899,000
More Info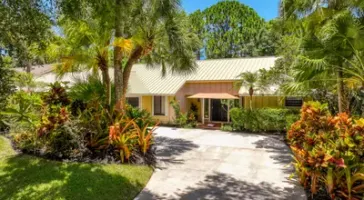
3 Beds | 2 Baths
Contact Charles at ..
Offered at $859,000
More Info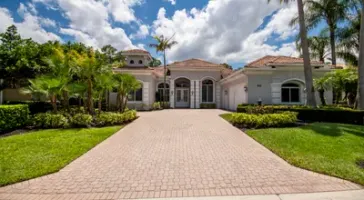
4 Beds | 4/1 Baths
Contact Brian at ..
Offered at $859,000
More Info








or Create your MyHomes account today?

In only 30 seconds you will have full access to property, community info and SOLD data you can't get anywhere else.