Get Email Updates
Get an email the instant your dream home hits the market with your MyLogin account
Updated August 17, 2026 12:01PM EST



18 FEB
Broward County opened 2026 in steady, balanced fashion. While prices dipped slightly and closed sales were nearly flat, contract activity is holding firm and inventory remains stable. This is not a dramatic market — it’s a measured, strategic one, where preparation and pricing make all the difference.
Let’s break it down.
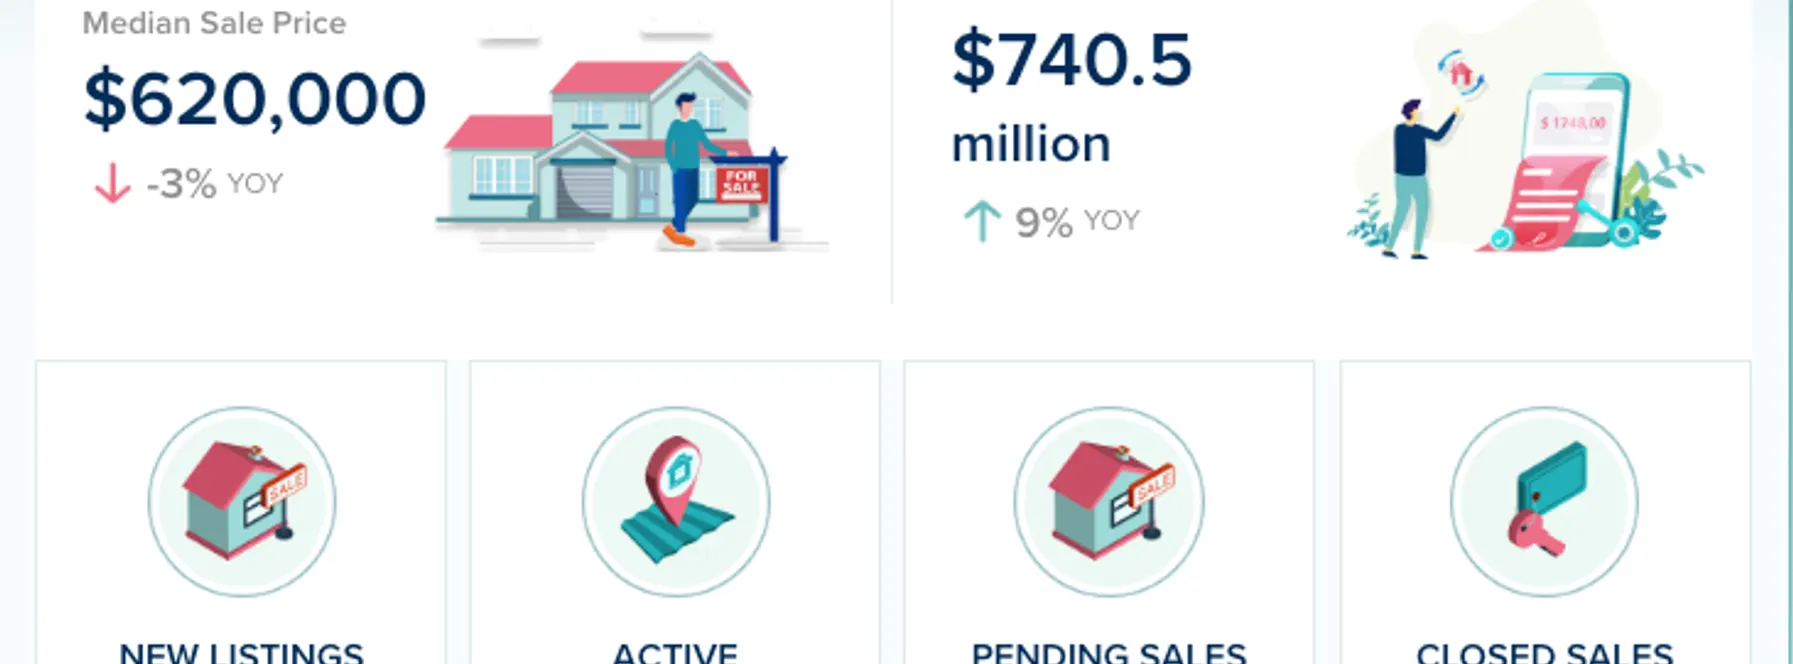
Median Sale Price: $620,000
🔻 Down 3% year-over-year
A modest pullback in pricing reflects normal market recalibration rather than weakness. With inventory also slightly down, this looks more like price stabilization than a trend shift.
Closed Sales: 757 homes
🔻 Down 1% year-over-year
Closings were nearly identical to last year — a sign of consistency. Buyers are still transacting, just not at accelerated levels.
Active Inventory: 5,082 homes
🔻 Down 3% year-over-year
Inventory tightened slightly, which helps prevent downward pressure on pricing. Supply and demand remain well aligned.
Pending Sales: 1,056 contracts
📈 Up 2% year-over-year
Contracts ticked upward, suggesting that February closings could show modest improvement.
Months of Inventory: 5.1 months
⏸️ No change year-over-year
Broward remains firmly in balanced market territory. Neither side has a dominant advantage.
Days on Market: 47 days
📈 Up 9% year-over-year
Homes are taking a bit longer to sell, which gives buyers more time to evaluate and negotiate.
New Listings: 1,868
📈 Up 1% year-over-year
New inventory is entering the market at a steady pace, keeping options fresh without flooding supply.
Buyers:
You’re in a stable market with reasonable leverage. Inventory is healthy and pricing has softened slightly — but well-priced homes are still moving.
Sellers:
The market is balanced, not aggressive. Strategic pricing and strong marketing are essential to attract today’s more selective buyer.
Investors:
Broward continues to deliver stability. Flat inventory and consistent demand make it a reliable market for long-term holds.
Broward County’s January numbers show a market that’s steady and disciplined. It’s not overheating, and it’s not slowing — it’s operating in a healthy middle ground.
In this kind of market, strategy wins.

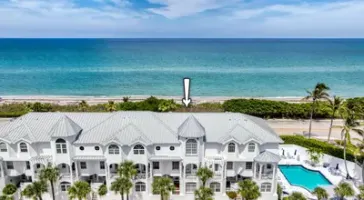
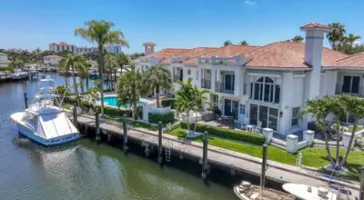
3 Beds | 3/1 Baths
Contact Charles at ..
Offered at $2,700,000
More Info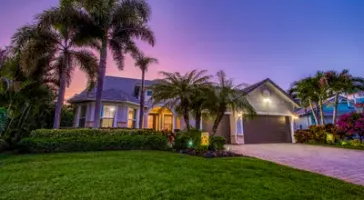
4 Beds | 4 Baths
Contact Sylvia at ..
Offered at $1,489,900
More Info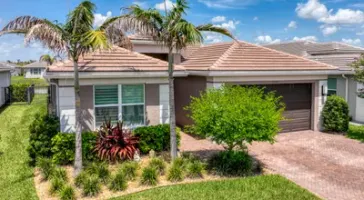
3 Beds | 3 Baths
Contact Andrew at ..
Offered at $650,000
More Info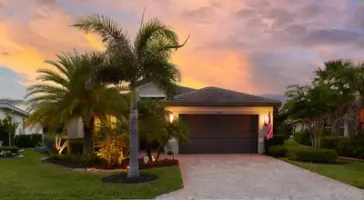
3 Beds | 2/1 Baths
Contact Susan at ..
Offered at $649,990
More Info








or Create your MyHomes account today?

In only 30 seconds you will have full access to property, community info and SOLD data you can't get anywhere else.