Get Email Updates
Get an email the instant your dream home hits the market with your MyLogin account
Updated September 16, 2026 10:54AM EST



19 JAN
Broward County ended 2025 with strong sales, increased buyer interest, and a healthy flow of new contracts. While prices dipped slightly, the underlying trends point to a balanced, active market that continues to reward both buyers and sellers — especially those who act strategically.
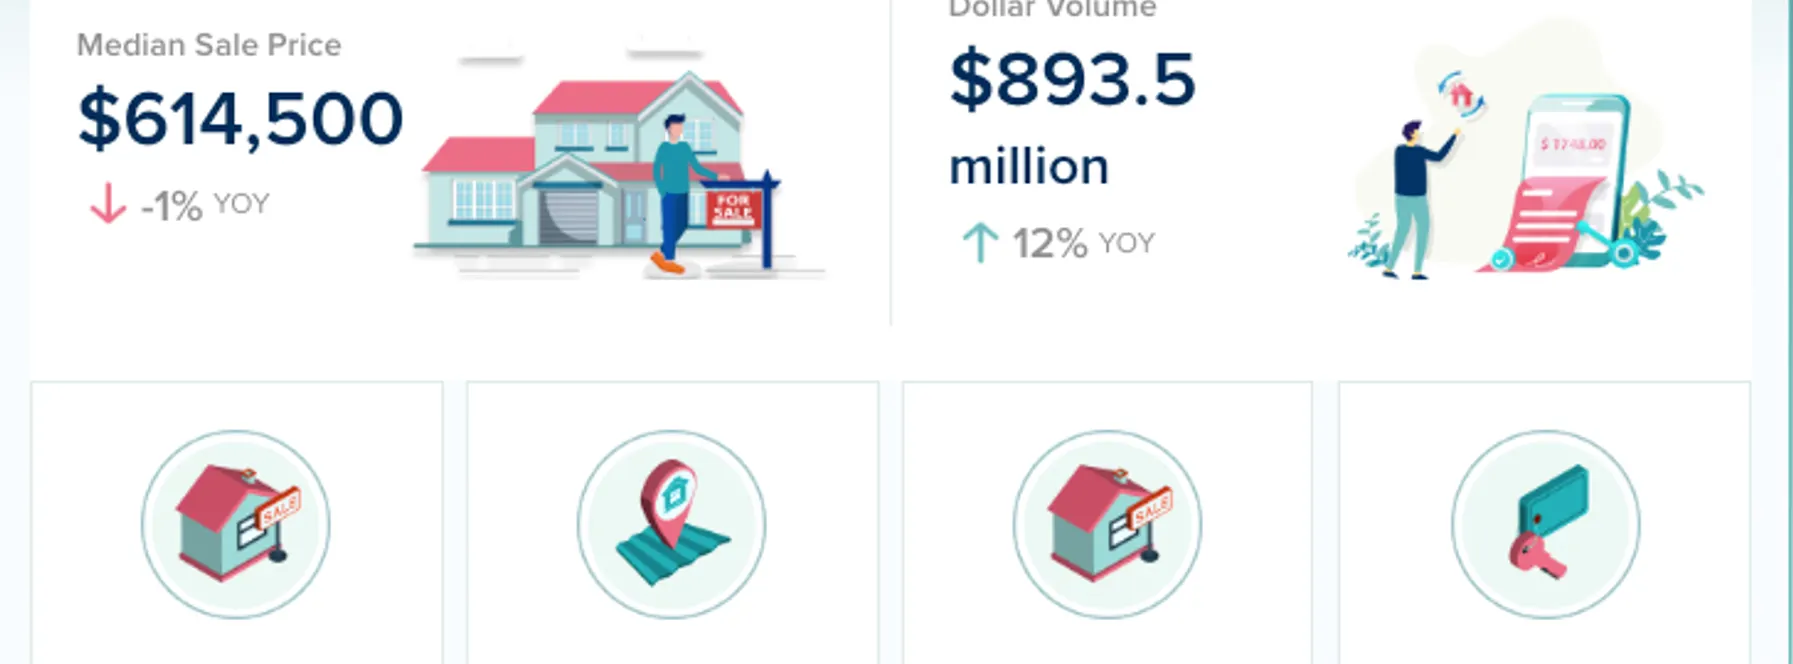
Median Sale Price: $614,500
🔻 Down 1% year-over-year
Prices remain stable with only a minimal dip, reflecting continued affordability pressure while maintaining long-term value. It’s a signal of normalization rather than weakness.
Closed Sales: 1,051 homes
📈 Up 11% year-over-year
A solid year-over-year jump in closed sales suggests buyers are motivated, even with elevated interest rates. This shows strong end-of-year momentum and broad market confidence.
Active Inventory: 4,825 homes
📈 Up 2% year-over-year
Inventory growth remains modest — just enough to offer more choice without overwhelming the market. It’s a healthy level of supply that keeps competition in check.
Pending Sales: 857 contracts
📈 Up 23% year-over-year
A major increase in pending sales points to an active start to 2026, with many buyers locking in deals before the new year.
Months of Inventory: 4.8 months
📈 Up 4% year-over-year
Still within the balanced market range, this slight increase gives buyers some breathing room while still supporting solid seller outcomes.
Days on Market: 50 days
📈 Up 25% year-over-year
Homes are taking a bit longer to sell — a common trend across South Florida. Buyers are shopping more carefully, and sellers should be ready to price right and stand out.
New Listings: 1,069
🔻 Down 3% year-over-year
A small dip in new listings means less fresh inventory, which could lead to stronger early-season demand in January and February.
Buyers:
There’s more time to shop and more inventory to choose from, but competition is still there. Be ready to act when the right opportunity appears.
Sellers:
Buyer demand is rising, and fewer new listings mean less competition for your home. If you’re thinking of listing in early 2026, you’re entering a strong window.
Investors:
With steady pricing and rising demand, Broward remains one of the most reliable year-round markets in South Florida for rental and resale potential.
Broward County finished 2025 with energy, balance, and opportunity. With contracts surging and inventory holding steady, this is a market where informed decisions and good timing can really pay off.


3 Beds | 3/1 Baths
Contact Charles at ..
Offered at $2,499,000
More Info
3 Beds | 2/1 Baths
Contact Andrea at ..
Offered at $1,600,000
More Info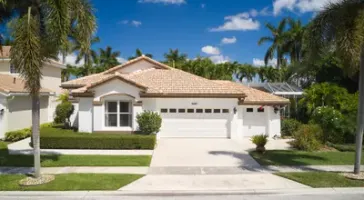
3 Beds | 2 Baths
Contact Jonathan at ..
Offered at $899,000
More Info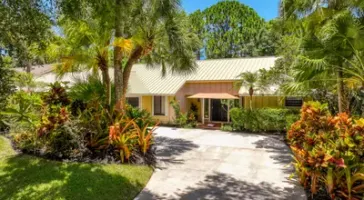
3 Beds | 2 Baths
Contact Charles at ..
Offered at $859,000
More Info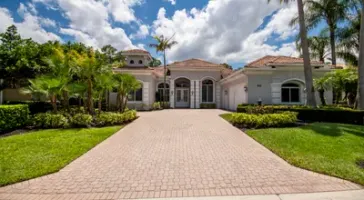
4 Beds | 4/1 Baths
Contact Brian at ..
Offered at $859,000
More Info








or Create your MyHomes account today?

In only 30 seconds you will have full access to property, community info and SOLD data you can't get anywhere else.