Get Email Updates
Get an email the instant your dream home hits the market with your MyLogin account
Updated September 16, 2026 10:54AM EST



16 SEP
All Residential Properties
Broward County’s residential real estate market continued to tighten in August 2026, with significantly fewer properties available than a year ago and homes selling faster overall.
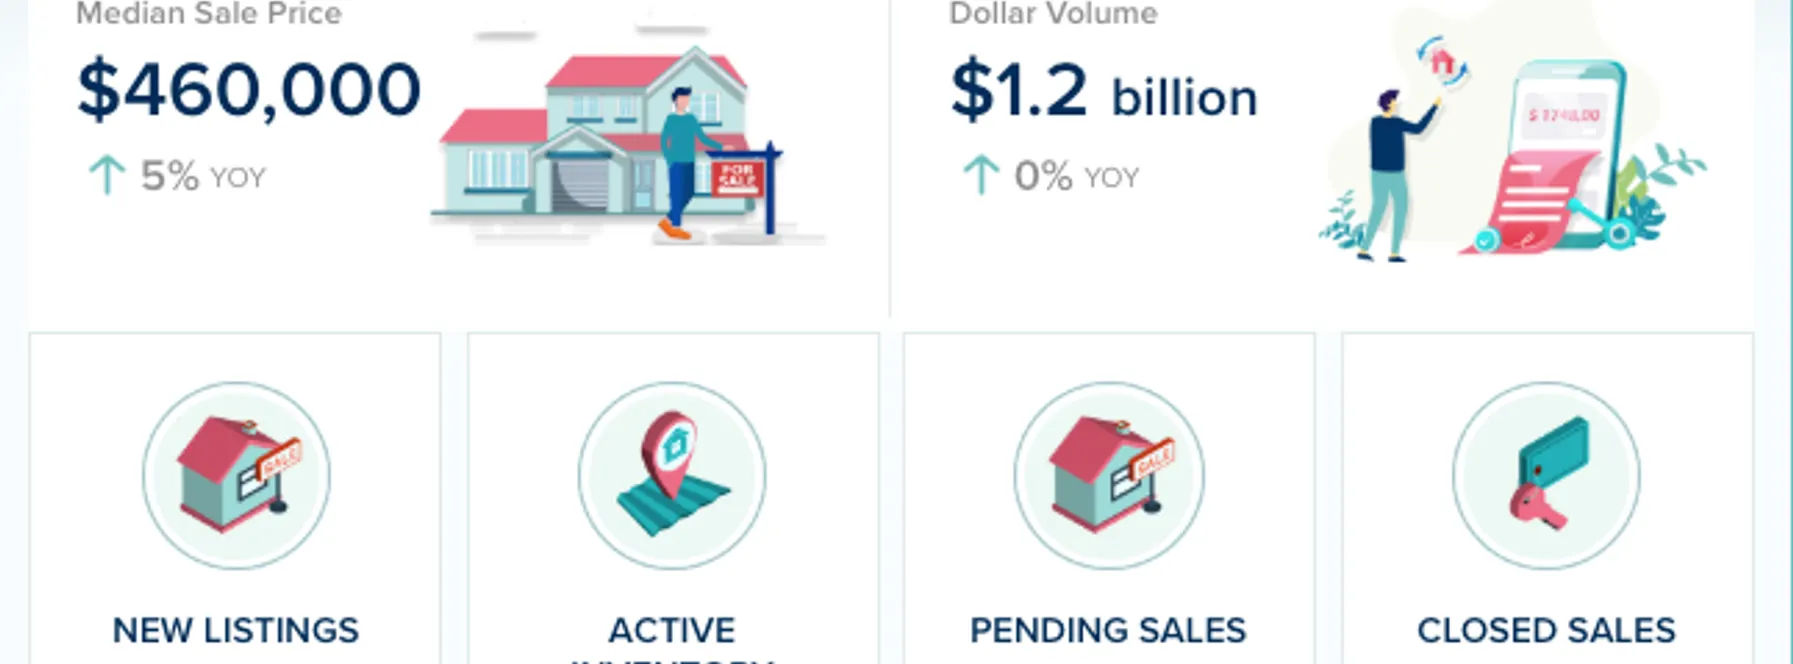
Across all residential property types, the median sale price increased 5% year-over-year to $460,000, while active inventory declined 17% and months of supply fell 21%. Days on market also decreased 7%.
However, transaction activity softened. Closed sales declined 4%, pending sales fell 7%, and new listings were down 3%.
Perhaps the most important takeaway is the significant divide beneath the countywide numbers. Broward County’s single-family and condo/townhome markets continue to operate under very different supply-and-demand conditions.
Here’s a closer look at the August numbers.
📈 Up 5% year-over-year
The median sale price across Broward County’s residential market reached $460,000 in August, 5% higher than a year ago.
Both major property sectors recorded higher medians, with single-family homes reaching $650,000 and condos and townhomes reaching $257,500.
However, the countywide median is also influenced by the mix of properties sold during the month. It should not be interpreted as every Broward County property increasing in value by 5%.
Recent comparable sales within the specific neighborhood, community and property type remain much more useful when evaluating an individual home.
🔻 Down 4% year-over-year
Closed sales declined 4% compared with August 2025.
The underlying sectors performed differently. Single-family sales were unchanged year-over-year, while condo and townhome sales declined 9%.
That distinction matters because it shows that the overall reduction in transactions was driven more heavily by the attached-home sector.
Despite significantly lower inventory across Broward County, transaction volume has not increased.
🔻 Down 17% year-over-year
Broward County had 17% fewer residential properties available than it did a year ago.
That is a substantial reduction in buyer choice.
However, the countywide figure masks a significant difference between property types. Single-family inventory declined 23%, while condo and townhome inventory fell 15%.
There are also still more than twice as many active condo and townhome listings as single-family listings, meaning buyers experience very different conditions depending on what they are searching for.
🔻 Down 7% year-over-year
Pending sales declined 7%, indicating softer contract activity compared with last August.
This is an important figure to watch because pending transactions can provide some indication of sales potentially moving toward closing.
Single-family pending sales declined 5%, while condo and townhome pending sales fell 8%, meaning softer activity is visible across both sectors.
🔻 Down 21% year-over-year
Overall months of supply declined substantially compared with August 2025.
That confirms Broward County’s residential market has tightened significantly over the past year.
However, property type remains critical when interpreting supply.
Single-family homes operate in a much tighter environment, while the condo and townhome sector continues to offer buyers considerably more selection.
As a result, the countywide inventory figure alone cannot fully describe the negotiating position of an individual buyer or seller.
🔻 Down 7% year-over-year
Residential properties that sold in August moved 7% faster than they did a year ago.
Again, there is an important difference underneath the overall number.
Single-family days on market declined 15%, while condo and townhome selling times were essentially unchanged.
That means much of the improvement in Broward County’s overall selling speed is being driven by the single-family sector.
🔻 Down 3% year-over-year
New listings declined 3% compared with last August.
With active inventory already down 17%, fewer new properties entering the market could make it difficult for overall supply to rebuild quickly.
However, the two major sectors again moved differently.
Single-family new listings increased 3%, while condo and townhome new listings declined 7%.
If that pattern continues, buyers could gradually see more fresh single-family opportunities while condo inventory continues to contract.
For Broward County buyers, property type makes an enormous difference right now.
Single-family buyers face significantly tighter supply, with inventory down 23% and properties selling 15% faster than they did last year. Being prepared when an attractive, appropriately priced home becomes available is particularly important.
Condo and townhome buyers have considerably more choice. Although inventory has declined, closed and pending sales are both down and selling times are essentially unchanged.
That can create negotiating opportunities, particularly on condos that have spent longer on the market.
Condo buyers should also carefully investigate HOA fees, reserve funding, insurance, special assessments, building maintenance and rental restrictions before purchasing.
Broward County sellers generally face less competition than they did a year ago, with overall inventory down 17%.
However, lower inventory has not resulted in greater sales volume.
Closed sales declined 4% and pending sales fell 7%, demonstrating that buyers remain selective.
Single-family sellers currently have the stronger supply-and-demand position, while condo and townhome sellers face considerably more competition from available listings.
In both sectors, accurate pricing and strong presentation remain essential.
For investors, Broward County’s segmented market creates very different opportunities depending on property type.
Single-family homes offer greater scarcity, while the larger condo and townhome inventory may provide more opportunities to negotiate.
For attached properties in particular, investors should look beyond the purchase price and carefully evaluate HOA fees, reserve levels, assessments, insurance, rental restrictions and the financial condition of the community.
Taxes, financing, maintenance and realistic rental income should also form part of any investment analysis.
Broward County’s August 2026 residential market is tighter than it was a year ago, but softer transaction activity shows that buyers remain selective.
The median sale price increased 5% to $460,000, while active inventory declined 17%, months of supply fell 21%, and properties sold 7% faster overall.
At the same time, closed sales declined 4%, pending sales fell 7%, and new listings decreased 3%.
But the most important story remains the difference between property types.
Single-family homes are operating in a much tighter environment, with sharply reduced inventory and faster selling times. Condos and townhomes still offer buyers considerably more choice, while sales and pending activity have softened.
For buyers and sellers, that means a broad statement about “the Broward County market” only tells part of the story. The specific property type, neighborhood, price range and individual listing conditions matter far more.
As we move toward the final quarter of 2026, the key trend to watch will be whether Broward County’s shrinking inventory begins to stimulate stronger transaction activity — or whether buyer selectivity continues to keep sales below last year’s levels.

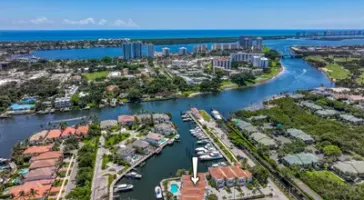
3 Beds | 3/1 Baths
Contact Charles at ..
Offered at $2,499,000
More Info
3 Beds | 2/1 Baths
Contact Andrea at ..
Offered at $1,600,000
More Info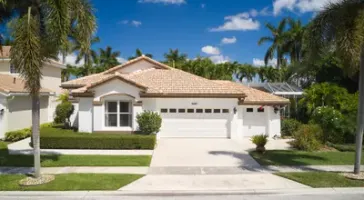
3 Beds | 2 Baths
Contact Jonathan at ..
Offered at $899,000
More Info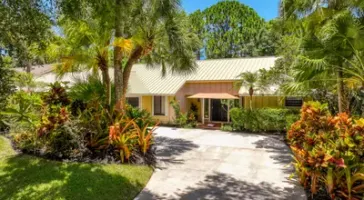
3 Beds | 2 Baths
Contact Charles at ..
Offered at $859,000
More Info
4 Beds | 4/1 Baths
Contact Brian at ..
Offered at $859,000
More Info








or Create your MyHomes account today?

In only 30 seconds you will have full access to property, community info and SOLD data you can't get anywhere else.