Get Email Updates
Get an email the instant your dream home hits the market with your MyLogin account
Updated August 17, 2026 12:01PM EST



19 MAY
Broward County’s spring market is accelerating quickly. Sales are rising, inventory is tightening sharply, and homes are selling dramatically faster than they were a year ago. Even with a slight dip in pricing, the overall market is showing clear signs of strong buyer demand and increasing competition.
Let’s break it down.
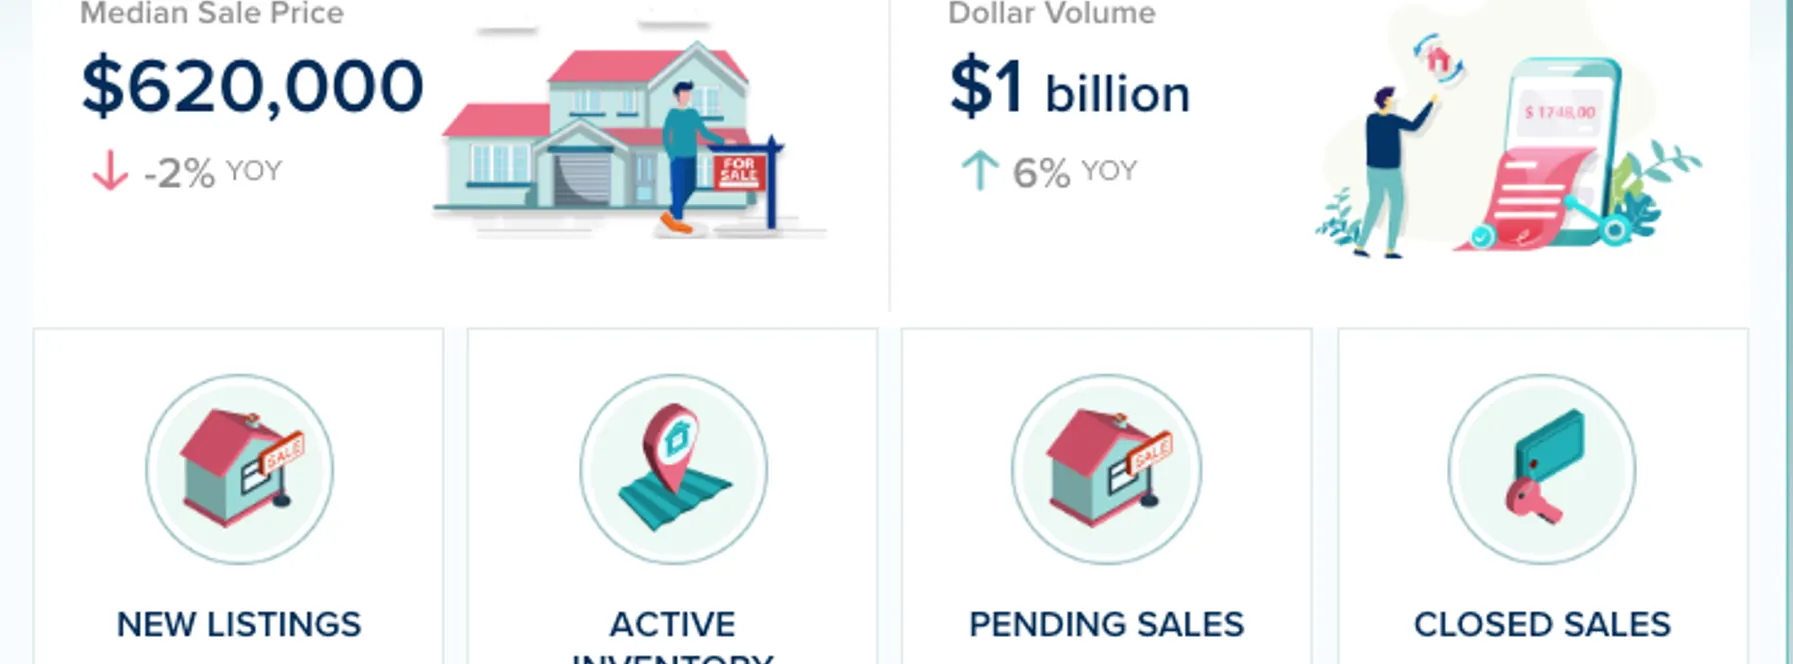
Median Sale Price: $620,000
🔻 Down 2% year-over-year
Prices softened slightly this month, but the decline remains minimal — especially considering the strength we’re seeing in sales and pending activity. This looks more like a healthy market adjustment than a slowdown.
Closed Sales: 1,134 homes
📈 Up 8% year-over-year
Sales activity continues to strengthen, showing buyers remain highly active throughout Broward County.
Active Inventory: 4,653 homes
🔻 Down 18% year-over-year
Inventory has tightened significantly, reducing buyer choice and increasing competition for well-priced homes.
Pending Sales: 1,348 contracts
📈 Up 20% year-over-year
This is one of the strongest indicators this month. Buyer demand is surging heading deeper into the spring season.
Months of Inventory: 4.6 months
🔻 Down 19% year-over-year
Broward has moved firmly into seller-favored territory. Supply levels are tightening quickly as demand continues to rise.
Days on Market: 33 days
🔻 Down 18% year-over-year
Homes are selling significantly faster than last year — one of the clearest signs of a competitive market.
New Listings: 1,569
🔻 Down 10% year-over-year
Fewer new listings are hitting the market, adding additional pressure to already shrinking inventory levels.
Buyers:
Competition is intensifying. With inventory dropping and homes moving quickly, preparation and fast decision-making are becoming increasingly important.
Sellers:
This is an exceptionally strong environment for sellers. Tight inventory, rising demand, and faster-moving homes all work heavily in your favor.
Investors:
Broward continues to show strong fundamentals with tightening supply and rising transaction activity supporting long-term value growth.
Broward County is clearly entering one of its strongest spring markets in recent months. Inventory is shrinking rapidly, contracts are surging, and homes are selling faster than they did last year.
The market momentum is real — and it’s building quickly.


3 Beds | 3/1 Baths
Contact Charles at ..
Offered at $2,499,000
More Info
2 Beds | 2 Baths
Contact David at ..
Offered at $414,890
More Info
2 Beds | 2 Baths
Contact Marisol at ..
Offered at $350,000
More Info
6 Beds | 7/2 Baths
Contact David at ..
Offered at $31,750,000
More Info








or Create your MyHomes account today?

In only 30 seconds you will have full access to property, community info and SOLD data you can't get anywhere else.